Chapter 8 — Linear Functions and
Standard: 8.PFA.3 — The student will represent and solve problems, including those in context, by using linear functions and analyzing their key characteristics (the value of the y-intercept (b) and the coordinates of the ordered pairs in graphs will be limited to integers).
By the end of this chapter you will be able to:
- Describe how adding a constant to a proportional relationship translates its line vertically (8.PFA.3a)
- Name the key characteristics of a linear function — slope , y-intercept , and the independent and dependent variables (8.PFA.3b)
- Graph a linear function from an equation, a table, or a situation in context (8.PFA.3c)
- Create a table of values for a linear function from a graph, from , or from a context (8.PFA.3d)
- Write the equation from a graph, a table, or a situation in context (8.PFA.3e)
- Invent a plausible real-world context for a linear function you are handed (8.PFA.3f)
Lessons: 8.1 Adding a Constant: Translating · 8.2 Key Characteristics of a Linear Function · 8.3 Graphing a Linear Function from an Equation · 8.4 Tables of Values for Linear Functions · 8.5 Writing from a Graph or a Table · 8.6 Linear Functions in Context · 8.7 Creating a Context for a Linear Function
Integer note. This standard puts a bound on the pictures: the value of the y-intercept and the coordinates of every plotted ordered pair are limited to integers. The slope may be a fraction — that is exactly what "rise over run" is for — but when you choose points to plot, choose the ones that land on grid corners. Lesson 8.4 shows you how to pick those -values on purpose.
Numbering note. Item numbers run straight through the chapter, from 1 in Lesson 8.1 to 172 at the end of the review. They do not restart at each lesson.
Lesson 8.1 — Adding a Constant: Translating
Where this chapter starts
In Grade 7 you studied proportional relationships. Their equation is
and their graph is always a straight line through the origin, because substituting gives . The number is the slope, the constant rate of change: the amount changes for each increase of in .
This chapter takes that line and adds one number to it. That single change produces the linear function
which is called slope-intercept form. Everything in Grade 8 algebra readiness runs through this equation, so the first job is to see exactly what the new number does.
Adding slides the whole line up or down
Start with and compare it to at the same -values.
Every entry in the third column is exactly more than the entry beside it. That is not a coincidence — it is arithmetic. Whatever works out to, adding raises the result by .
Since the -coordinate of every point rises by while its -coordinate does not move at all, every point slides straight up units. Sliding every point of a figure the same distance in the same direction is a translation. So:
Adding a constant to translates the line vertically — up units when is positive, down units when is negative.
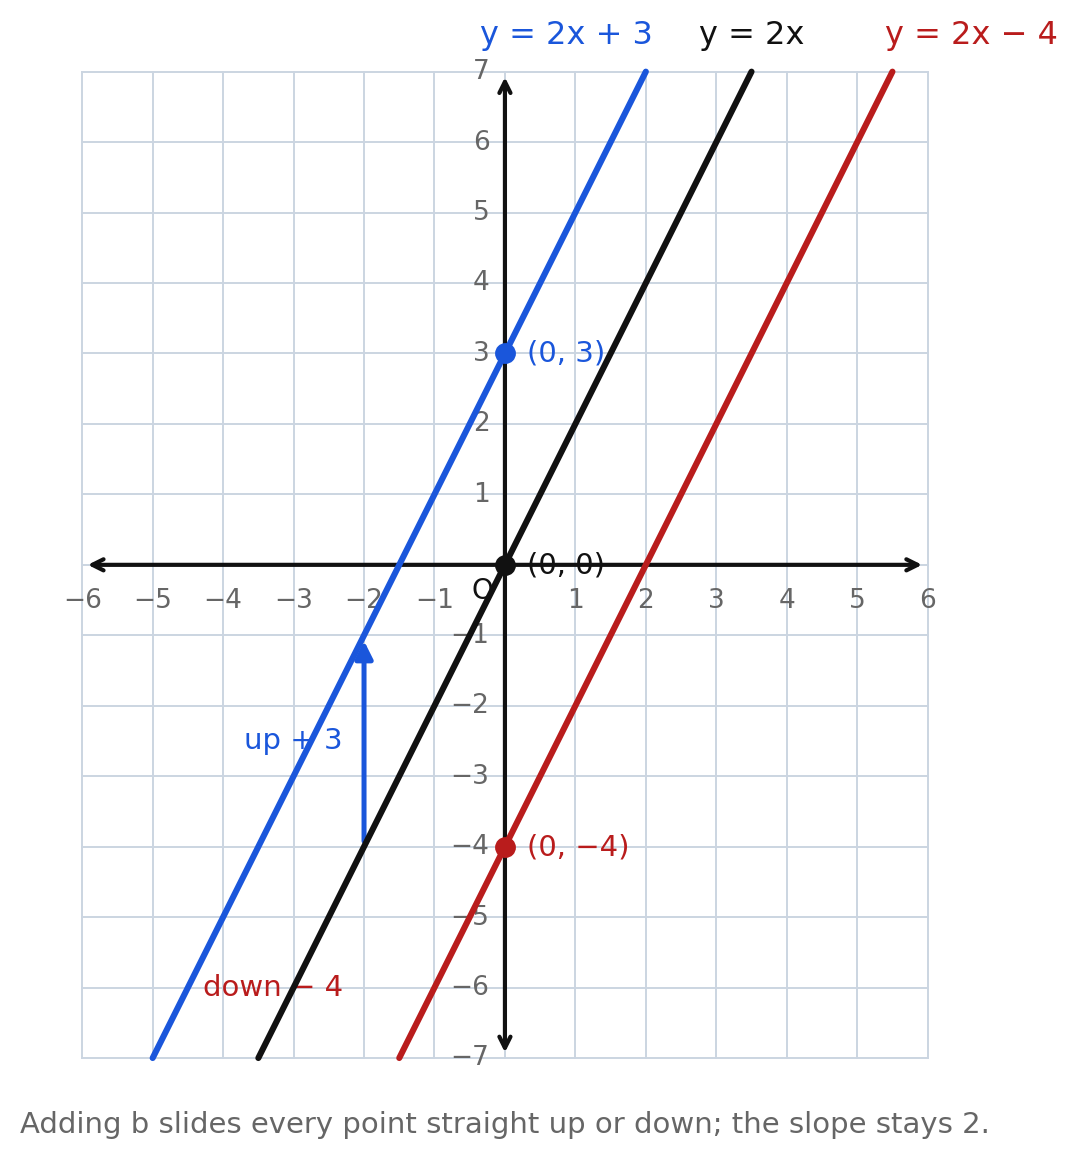
The figure shows all three lines. The blue line is translated up ; the red line is translated down , because is .
The translation does not change the slope
Look at the three lines again. They never cross. They cannot cross, because at every single -value the blue line sits exactly above the black one and the red line exactly below it — the gap never shrinks.
Lines with the same slope and different y-intercepts are parallel. Translating a line vertically moves it without turning it, so the slope survives the move untouched: all three lines still rise for every run of .
Here is the same idea with a fractional slope, .
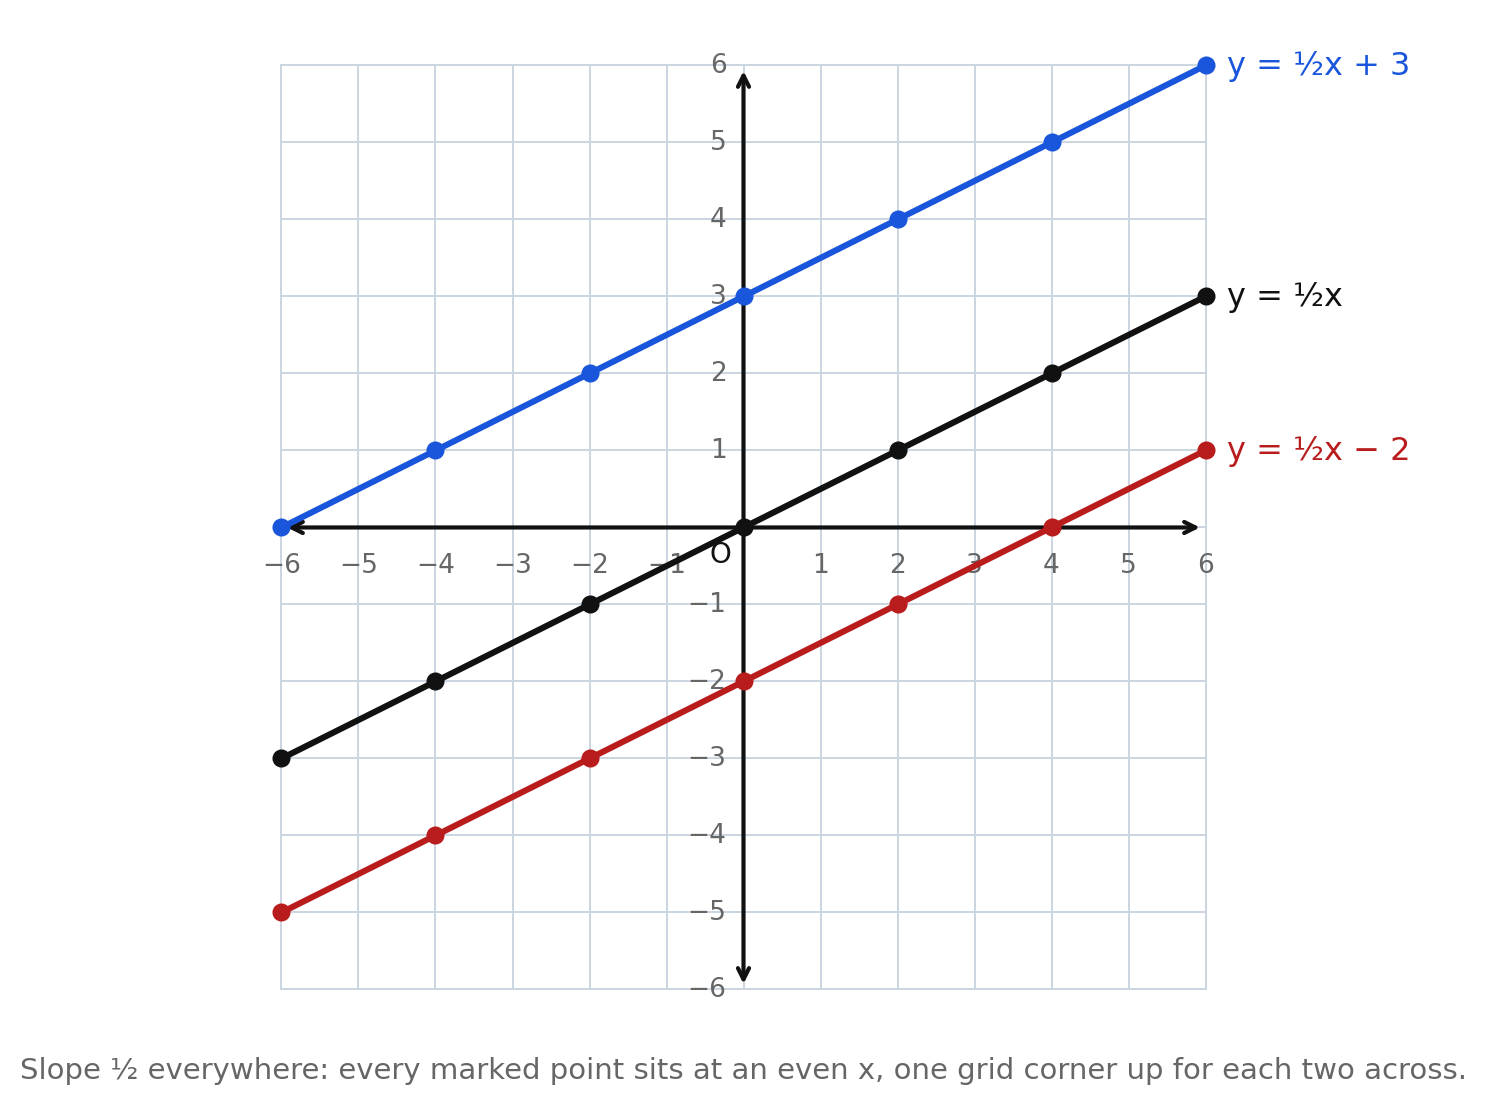
Every one of those lines rises for every run of . Notice which points are marked: only the ones at even -values, because those are where a line of slope passes through a grid corner. A fractional slope is allowed; a plotted point with a fractional coordinate is not.
Where the new line crosses the y-axis
Substitute into :
So the line passes through no matter what is. That point is the y-intercept, and is its -coordinate. In the first figure the three y-intercepts are , , and — read them straight off the equations.
This also tells you when a linear function is not proportional. A proportional relationship must contain . If , the line misses the origin, so is linear but not proportional.
Worked examples
Example 1 — Naming the translation
Describe how the graph of is related to the graph of .
Both have slope . The constant raises every -value by .
Answer: It is the line translated up units.
Example 2 — A negative constant
Describe how the graph of is related to the graph of .
Rewrite the constant as an addition: . Adding lowers every -value by .
Answer: It is the line translated down units.
Example 3 — Writing the equation of a translated line
The line is translated down units. Write the equation of the image.
Translating down means subtracting from every -value, so . The slope does not change.
Answer:
Example 4 — How far apart are two parallel lines?
How far apart, vertically, are and ?
At any , the difference of the -values is .
Answer: units, at every -value. The lines are parallel.
Example 5 — Deciding whether a relationship is proportional
Is proportional? Justify your answer.
Substituting gives , so the graph passes through , not the origin. A second check: at , , but at , . The ratio is not constant.
Answer: No. It is linear but not proportional, because .
Guided practice
- The graph of is translated up units. Describe the resulting line and write its equation.
- Describe how the graph of is related to the graph of .
- What proportional line was translated to produce , and how far did it move?
- Write the equation of the line produced by translating down units.
- Does translating a line vertically change its slope? Explain in one sentence.
- Give the y-intercept of as an ordered pair.
Independent practice
- For each equation, name the proportional parent line and describe the translation. a) b) c) d)
- Write the equation of the line produced by translating up units.
- Write the equation of the line produced by translating down units.
- Look at the figure of , , and . Which line is highest at ? Give the ordered pair that shows it.
- How far apart vertically are and , and does that distance depend on ? Show the subtraction that settles it.
- Copy and complete the table, then state how the two output columns are related.
- Is a proportional relationship? Give two reasons.
- Reasoning. Explain why the graphs of and never meet, no matter how far the grid is extended.
- Application. In Grade 7 a pool filling from empty at inches per hour was modeled by . Today the pool already holds inches of water before the hose is turned on. Write the new equation and describe what happened to the graph.
- Error analysis. A student says the graph of is the graph of translated units to the left. Explain the mistake and describe the translation correctly.
Exit ticket 8.1
- Write the equation of the line produced by translating up units.
- Name the parent line and the translation for .
- Give the y-intercept of as an ordered pair.
- Explain why a vertical translation cannot change the slope of a line.
Lesson 8.2 — Key Characteristics of a Linear Function
The four things to name
A linear function is a function whose graph is a straight line. Written in slope-intercept form,
it has four key characteristics, and this standard asks you to describe all of them by name.
The slope . The coefficient of . It is the rate of change: the amount changes for each increase of in . As a fraction it is
The y-intercept . The -coordinate of the point where the line crosses the -axis, which is . Substituting into the equation gives it immediately.
The independent variable. The input, . You choose it, or the situation hands it to you. It goes in the left column of a table and along the horizontal axis.
The dependent variable. The output, . Its value depends on the value of . It goes in the right column of a table and along the vertical axis.
The sentence " is a function of " is another way of saying that is independent and is dependent. In a context, ask which quantity is being decided by the other: the total cost of a taxi ride depends on how far you go, so the miles are independent and the cost is dependent, never the reverse.
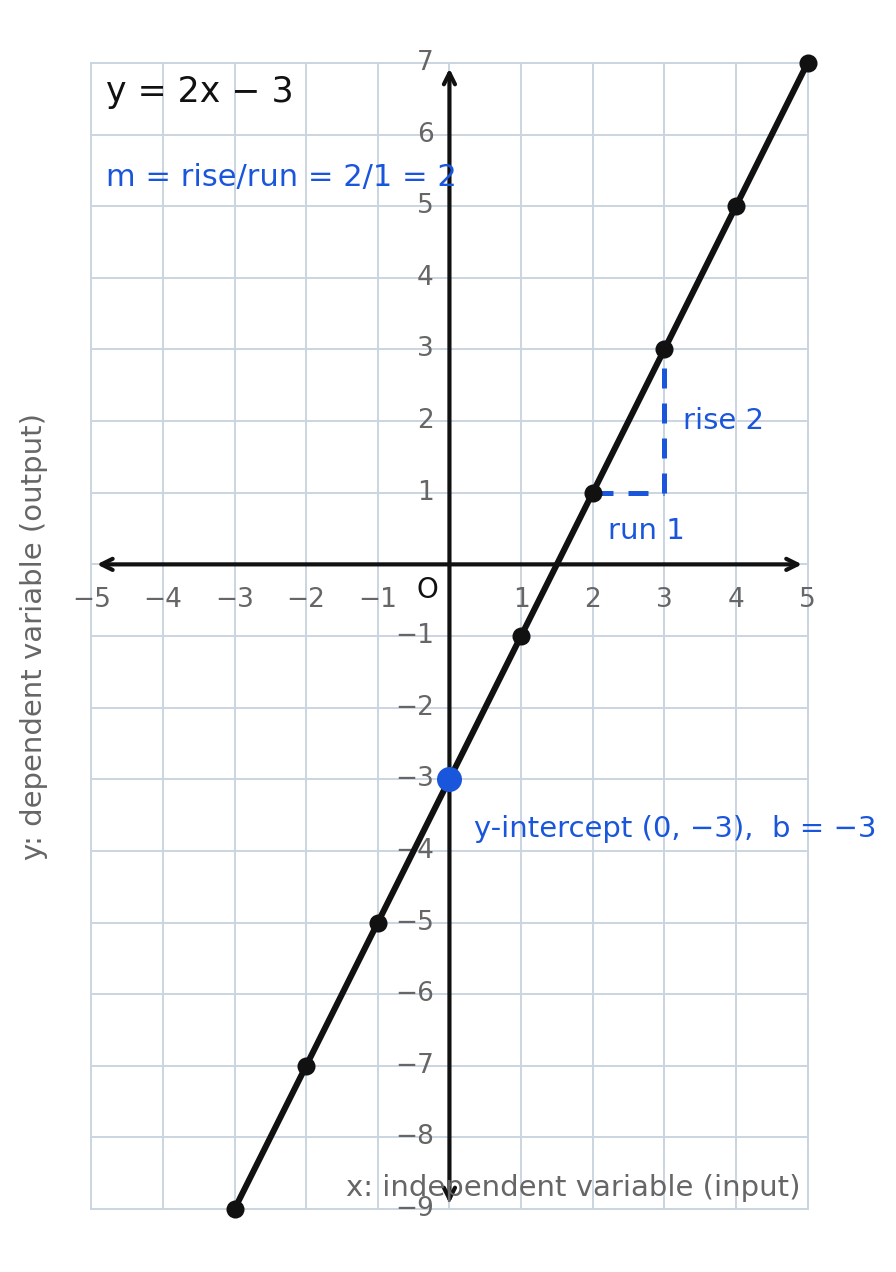
For : , so the line rises for every run of ; , so it crosses the -axis at ; is the independent variable and the dependent variable.
Reading and off an equation, carefully
Slope-intercept form has to actually be in that form before you read the numbers off it. Two traps come up constantly.
A subtraction sign belongs to the number after it. In , the y-intercept is , not .
The terms may be written out of order. In the -term comes second. Rewrite it by the commutative property of addition:
so and . A student who reads left to right and answers ", " has the two numbers exactly backwards.
An equation with no visible has : is , and it is the proportional case. An equation with no visible -term has : is .
What the sign of looks like
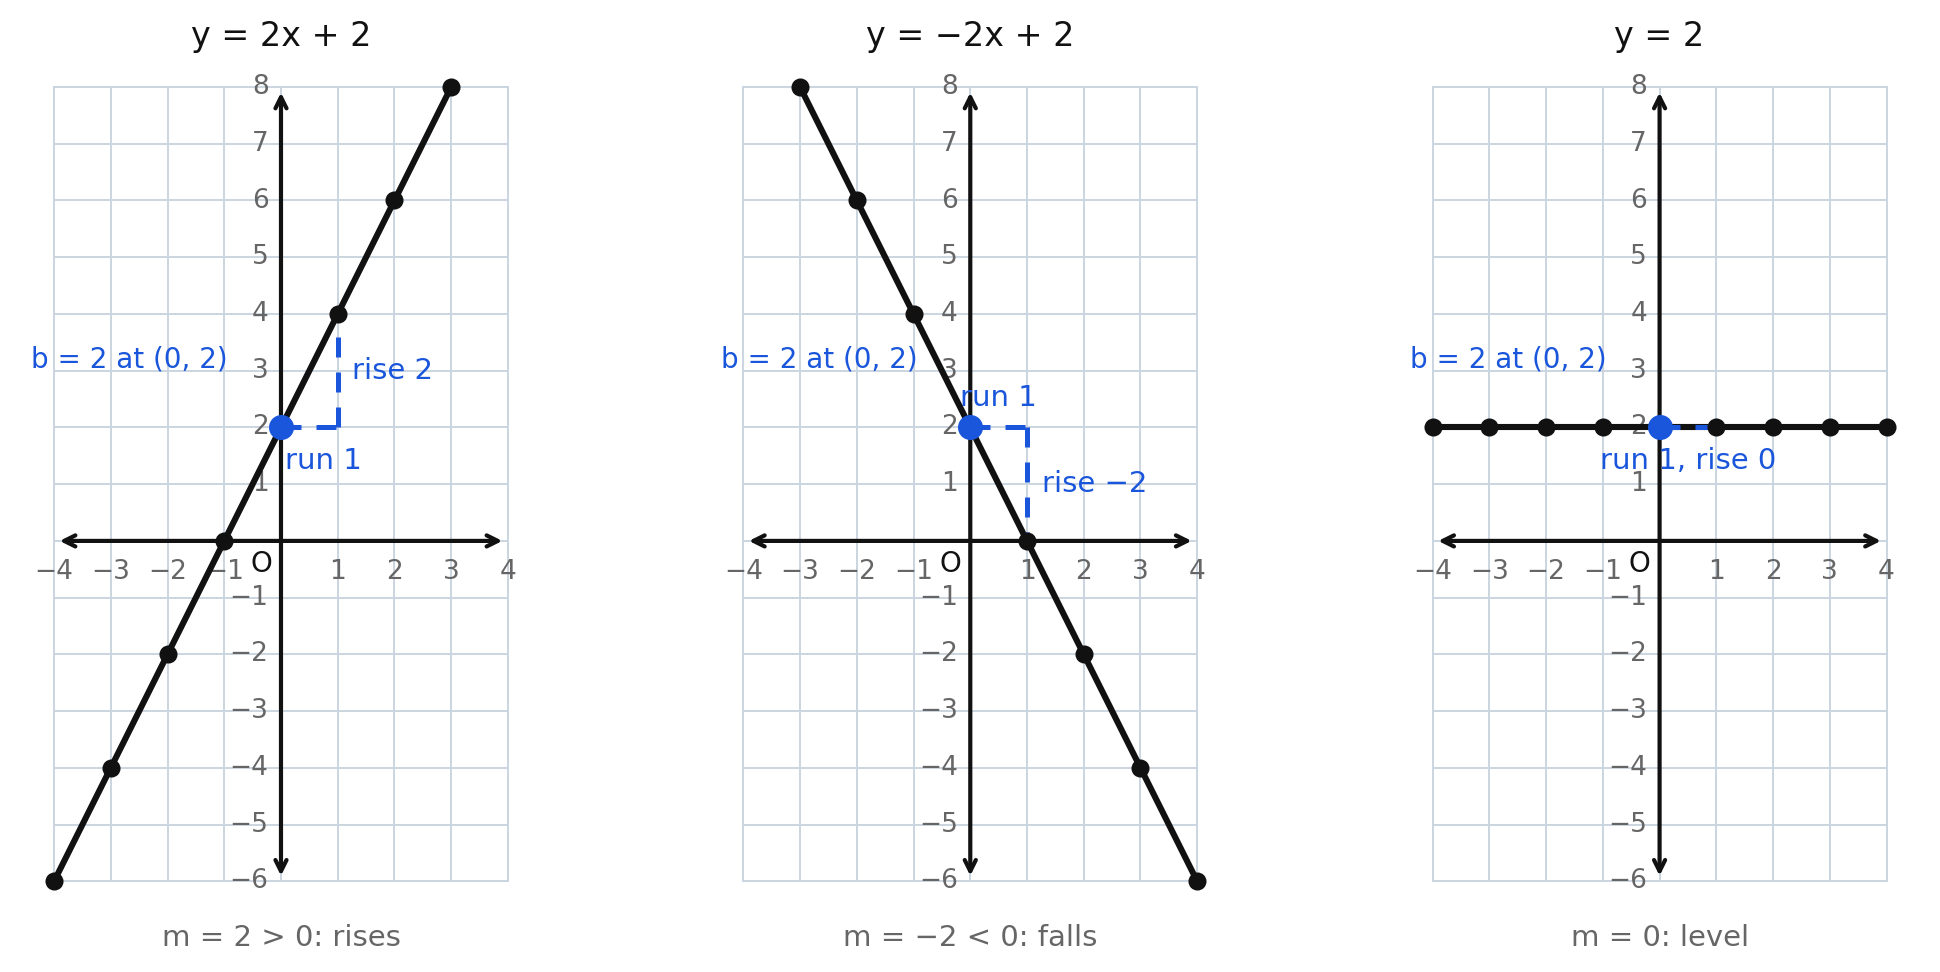
- : the line rises left to right. As increases, increases.
- : the line falls left to right. As increases, decreases.
- : the line is level. Every input gives the same output, .
All three lines in the figure have , so all three pass through . Two linear functions with the same y-intercept always share that one point.
Steepness is about the size of , not its sign. Comparing with : the first climbs units per step across, the second climbs half a unit, so the first is steeper. And is steeper than , even though it falls, because .
Worked examples
Example 1 — Naming and
Name the slope and y-intercept of .
The coefficient of is ; the constant term is .
Answer: , , so the line crosses the -axis at .
Example 2 — Terms out of order
Name the slope and y-intercept of .
Rewrite as .
Answer: ,
Example 3 — Interpreting and in a situation
A gym charges $30 to join plus $15 each month. The total paid after months is . Name the independent variable, the dependent variable, , and , and say what each number means.
Answer: , the number of months, is independent; , the total paid, is dependent. dollars per month is the rate the bill grows. dollars is the amount owed at , before any month has passed — the joining fee.
Example 4 — Comparing steepness
Which is steeper, or ? Which rises?
Compare sizes: , so the second is steeper. Compare signs: , so the first rises and the second falls.
Answer: is steeper; is the one that rises.
Example 5 — A zero slope
Describe the graph of and name its key characteristics.
Every input gives .
Answer: A level horizontal line through ; and . The dependent variable never changes, no matter what the independent variable does.
Guided practice
- Name and for .
- Name and for .
- The cost of a taxi ride depends on the number of miles driven. Which quantity is the independent variable?
- Does the graph of rise or fall from left to right? Name the characteristic that decides it.
- Give the y-intercept of as an ordered pair.
- What is the slope of , and what does its graph look like?
Independent practice
- Copy and complete the table.
| Equation | ||
|---|---|---|
| a) | ||
| b) | ||
| c) | ||
| d) | ||
| e) |
- Use the figure of . State , state as an ordered pair, and list the coordinates of three other plotted points on the line.
- State whether each line rises, falls, or is level. a) b) c) d)
- Which is steeper, or ? Justify your answer using rise and run.
- A phone plan costs dollars, where is the number of gigabytes used. Name the independent variable, the dependent variable, , and , and say what and mean in the situation.
- Reasoning. Two linear functions have the same y-intercept but different slopes. Name one thing their graphs must have in common and one thing that must differ.
- Reasoning. Explain why a linear function has exactly one y-intercept. Use the equation in your explanation.
- For , name and , and explain what the negative slope tells you about how behaves as increases.
- Application. A lawn service charges $12 to show up plus $9 per hour of work. Write the equation for the total charge after hours, then name , , and both variables.
- Error analysis. For , a student writes and . Explain the error and give the correct values.
Exit ticket 8.2
- Name and for .
- Name and for .
- The distance a car has traveled depends on how long it has been driving. Name the dependent variable and explain your choice.
- Explain what the slope of a linear function tells you that the y-intercept does not.
Lesson 8.3 — Graphing a Linear Function from an Equation
Two moves, in this order
Slope-intercept form is built for graphing, because the equation hands you a point and a direction.
Step 1. Plot the y-intercept . You do not have to compute anything; is sitting in the equation.
Step 2. From that point, use as to step to a second point. Move right by the run, then up or down by the rise. Then draw the line through the two points.
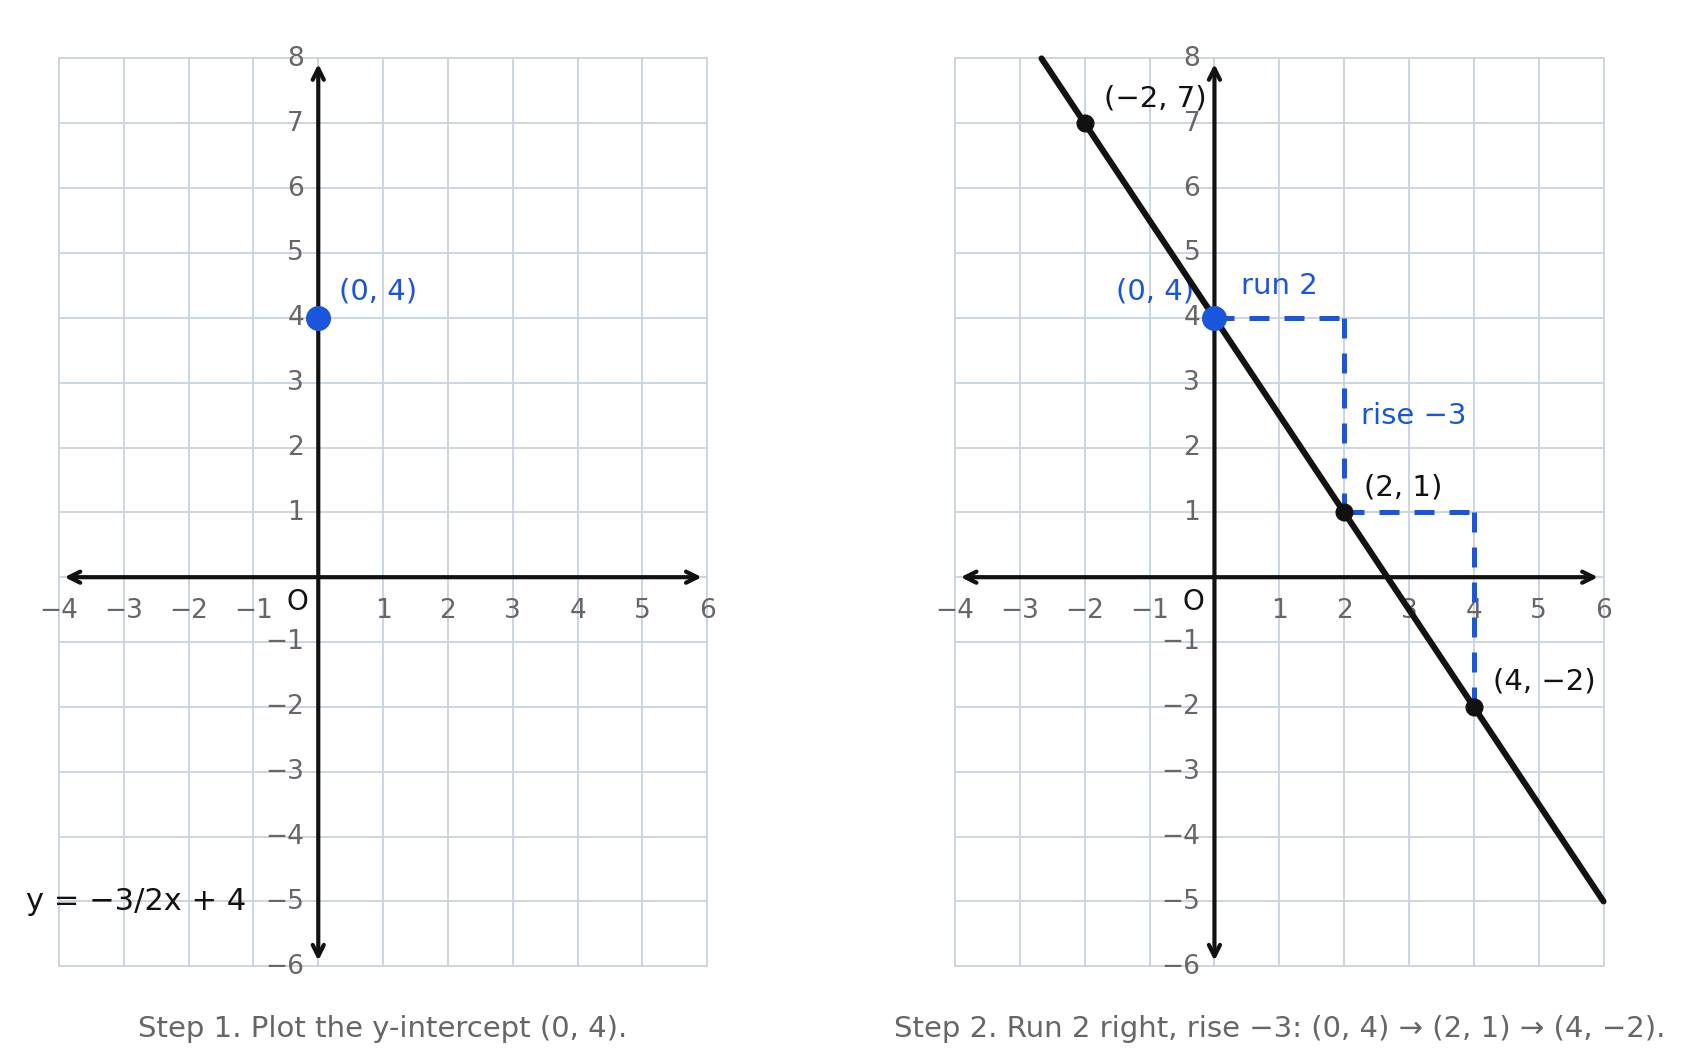
The figure graphs . Step 1 plots . Step 2 reads the slope as : run to the right, rise , which is down . That lands on . Stepping again lands on . Check against the equation: . ✓
Whole-number slopes hide a denominator of 1
A slope like is : right , up . A slope of is : right , down .
This is where the most common graphing error in the chapter lives. Given , a student who moves right and down has used the slope and drawn the wrong line. The numerator is the rise; the denominator is the run. Say it as "rise over run" every time and the two cannot swap.
Fractional slopes and integer points
When is a fraction, stepping by rise-over-run automatically lands you on grid corners, which is exactly what the standard requires. For : start at , run , rise , land on ; again gives . Every point is a lattice point.
Stepping backwards works too, and it is often what you need to fill the left half of the grid: reverse both directions. From , run and rise gives .
Always plot a third point
Two points determine a line, but three points catch mistakes. Compute one extra value straight from the equation and check that it lands on the line you drew. For at :
so should be on the line — and it is.
Worked examples
Example 1 — An integer slope
Graph and list three points on it.
Plot . Slope : right , up to ; again to .
Answer: , ,
Example 2 — A negative integer slope
Graph and list three points.
Plot . Slope : right , down to ; again to .
Answer: , ,
Example 3 — A fractional slope
Graph and list three points with integer coordinates.
Plot . Slope : right , up to ; again to .
Answer: , ,
Example 4 — Stepping backwards as well
Graph , using points on both sides of the -axis.
Plot . Slope : right , down to . Reversing, left and up to .
Answer: , ,
Example 5 — A zero slope
Graph .
Rewrite as . Plot ; the rise is for every run, so the line is level.
Answer: A horizontal line through , containing and .
Example 6 — Graphing a context
A candle is centimeters tall and burns down centimeters per hour. Write and graph the function, then say what the point where it meets the -axis means.
The height starts at , so ; it decreases per hour, so . The function is . Plot , then step right down : , , and so on to .
Answer: . The point means the candle burns out after hours, so only -values from to make sense in the story.
Guided practice
Graph each function. Plot the y-intercept first, then use the slope, and list three points with integer coordinates.
Independent practice
- Graph and list three points with integer coordinates.
- Graph and list three points with integer coordinates.
- Graph , listing one point to the left of the -axis and one to the right.
- Graph , listing one point on each side of the -axis.
- Graph and list three points with integer coordinates.
- Graph and on the same grid. Describe how the two lines are related and how far apart they are.
- Reasoning. Why does plotting first make graphing faster than building a whole table of values?
- Application. A candle is centimeters tall and burns centimeters per hour. Write the function, graph it from to , and explain what means.
- Application. A taxi charges $3 when you get in plus $2 per mile. Write the function, graph it from to , and use the graph to find the cost of a -mile ride.
- Error analysis. To graph , a student starts at and moves right and down . Explain the error, name the slope the student actually used, and describe the correct move.
Exit ticket 8.3
- Graph and list three points with integer coordinates.
- Graph and list three points with integer coordinates.
- Graph and list three points with integer coordinates.
- Explain how the sign of tells you which way to move after you plot the y-intercept.
Lesson 8.4 — Tables of Values for Linear Functions
Building a table from the equation
A table of values lists inputs beside their outputs. To build one from , choose -values, substitute, and record. Show the substitution rather than doing it in your head — that is where sign errors get caught.
For :
| substitution | ||
|---|---|---|
Two features of that table are worth naming, because Lesson 8.5 will run them in reverse.
The row at shows . Here when , and .
Equal steps in produce equal steps in . Each goes up by and each goes up by , which is . That constant step is what makes the function linear.
Choosing -values on purpose
When is a fraction, careless -values produce outputs you cannot plot. For , choosing gives — a real value, but not a plottable ordered pair under this standard.
Choose -values that are multiples of the denominator of . For , use . For , use .
For that gives:
Always include when you can. It costs nothing and it hands you .
Building a table from a graph
Reading a table off a graph is just recording the lattice points the line passes through. Start at the y-intercept and follow the slope.
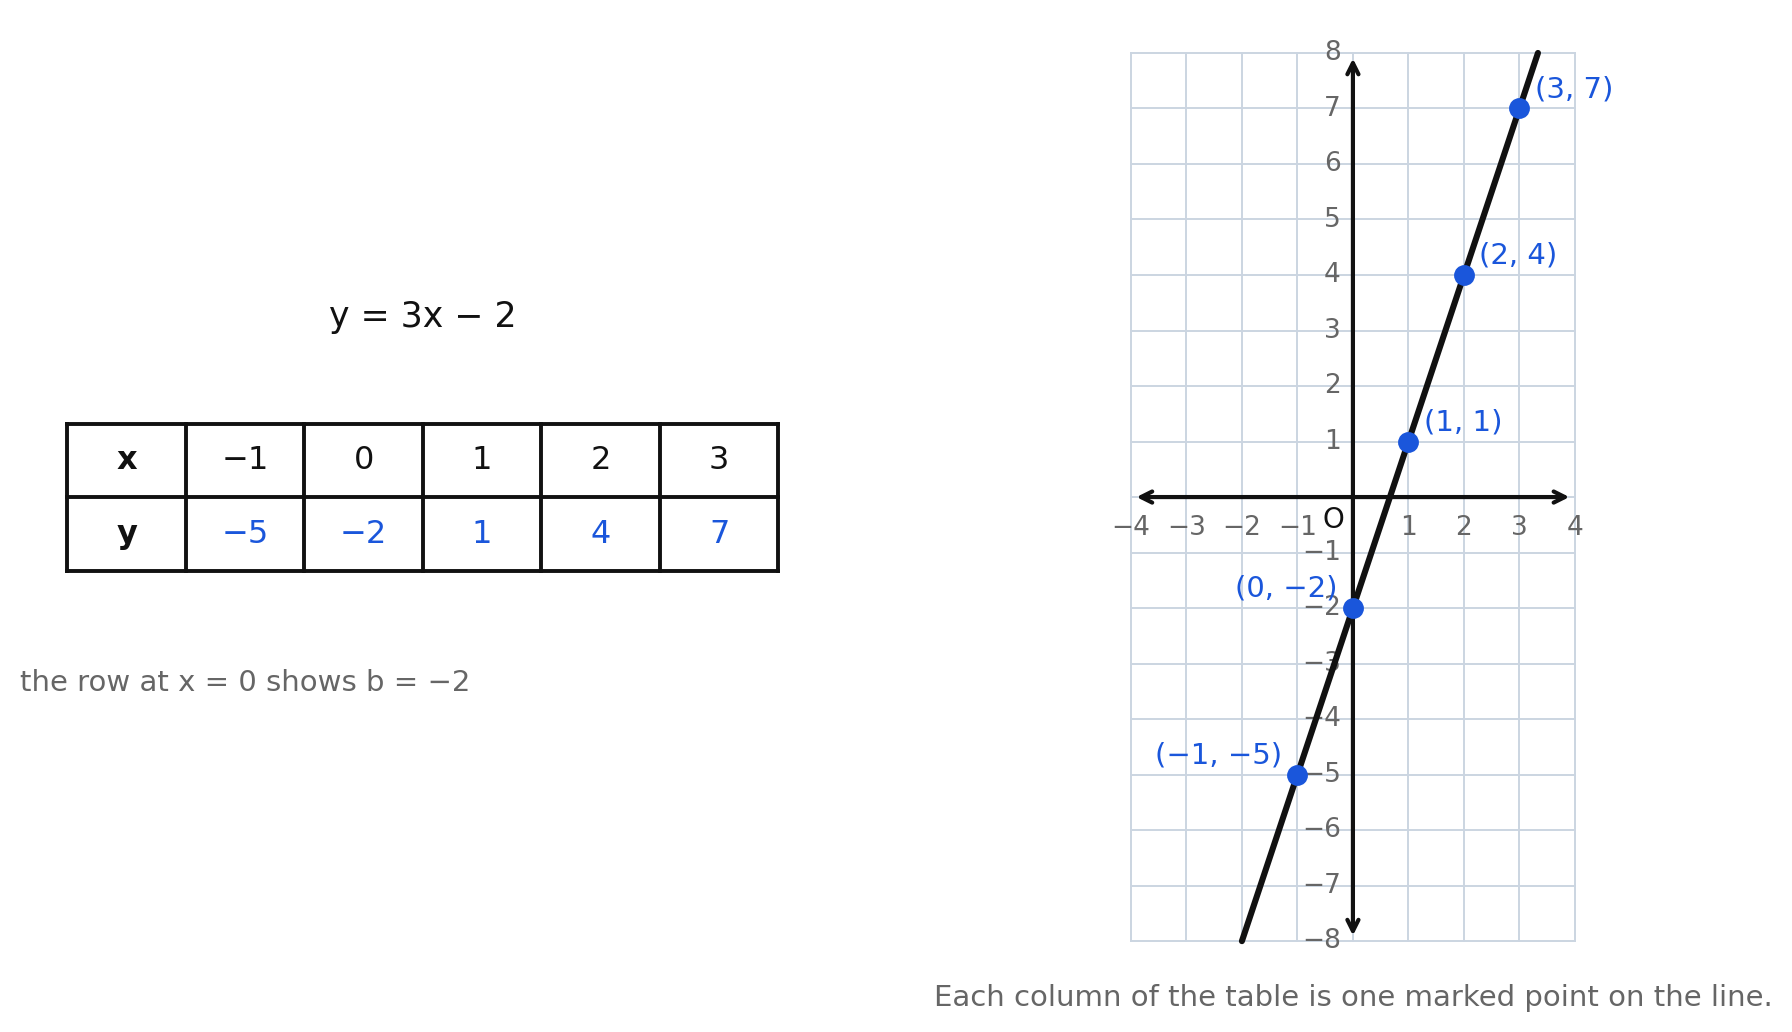
The line is . Its table, read straight off the marked points:
Check any row against the equation: . ✓
Testing whether a table is linear
Not every table comes from a linear function. Test it: take equal steps in and see whether the steps in are also equal.
The -values change by , then , then . The rate of change is not constant, so this table is not linear and no equation fits it.
Worked examples
Example 1 — Table from an equation
Make a table for at .
; ; ; ; .
Answer:
Each step of in drops by , matching .
Example 2 — Choosing -values for a fractional slope
Make a table of four integer ordered pairs for .
The denominator of is , so use multiples of : .
; ; ; .
Answer:
Example 3 — Table from a graph
The graph of passes through the lattice points shown in the figure for Lesson 8.5. Write a table for .
Follow the line: from , each step right drops .
Answer:
Example 4 — Table from a context
A saver starts with $25 and adds $10 every week. Make a table for weeks through , and find when the total reaches $85.
Starting amount is ; the weekly is ; so .
Continuing the pattern: at week , at week . Check: . ✓
Answer: The table above; the total reaches $85 in week .
Example 5 — Deciding whether a table is linear
Is the table with and linear?
Equal -steps of give -steps of , , and .
Answer: No. The rate of change is not constant, so the function is not linear.
Guided practice
- Make a table for at .
- Make a table for at .
- Make a table for at .
- Read the graph of in this lesson and write its table for .
- Make a table for at .
- In a table for a linear function the -values go up by each row. What must be true of the -values? Name the characteristic involved.
Independent practice
- Make a table for at , and state the constant change in .
- Make a table for at .
- Make a table of four integer ordered pairs for . Explain how you chose the -values.
- Make a table for at . What is the slope, and how does the table show it?
- Using the graph of from Lesson 8.5, write a table of four ordered pairs read from the line.
- A bike rental charges $5 plus $3 per hour, so . Make a table for through .
- A tank holding liters drains liters per minute, so . Make a table for through , and say what the last row means.
- Reasoning. A table has and . Is the function linear? Show the test you used.
- Application. A saver starts with $25 and adds $10 a week. Write the equation, make a table for weeks through , and find the week the total reaches $85.
- Error analysis. Making a table for , a student chose and got -values that were not integers. Explain why, and suggest four better -values.
Exit ticket 8.4
- Make a table for at .
- Make a table for at .
- Choose four -values for that give integer -values, and complete the table.
- Explain how you can find directly from a table of values.
Lesson 8.5 — Writing from a Graph or a Table
From a graph: read , then count the slope
Every graph of a linear function tells you both numbers you need.
Find . Look at where the line crosses the -axis and read the -coordinate.
Find . Pick two lattice points on the line — points at grid corners, so you are counting exactly and not estimating. Count the rise from the first to the second, then the run, and write
Counting down or left gives a negative rise or run.
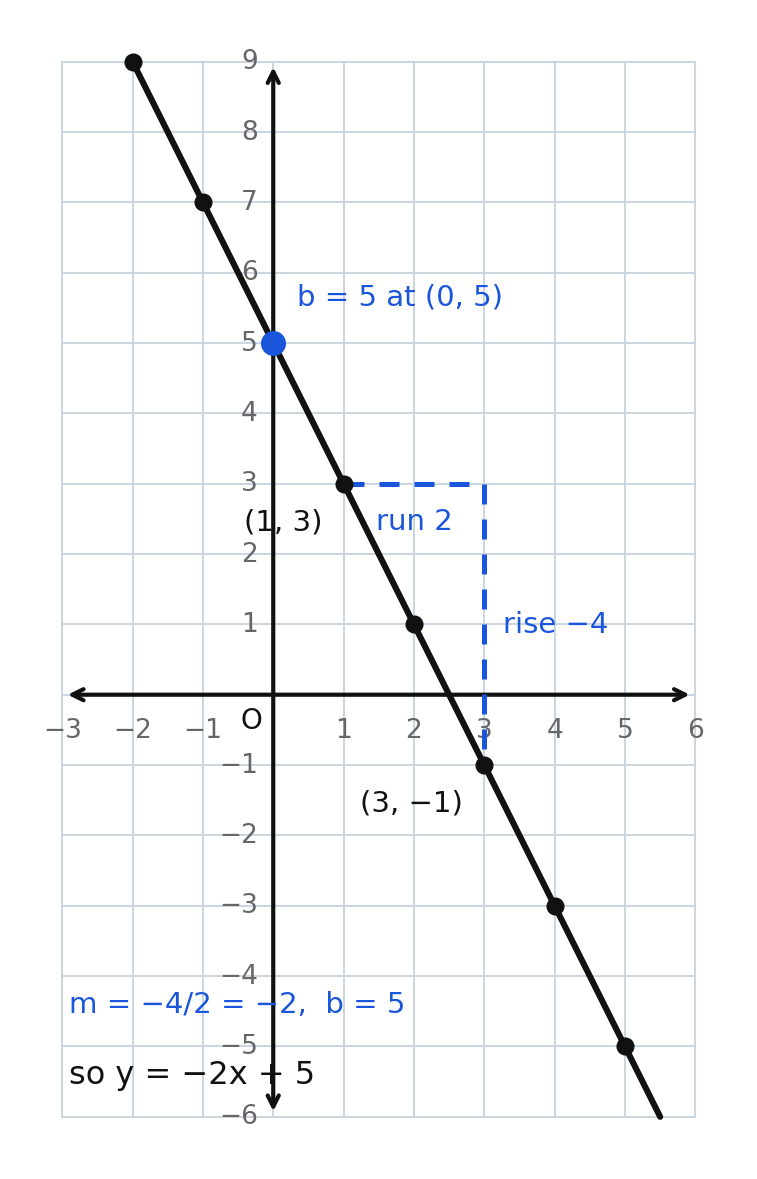
The line crosses the -axis at , so . From the lattice point to the lattice point the line runs right and rises , so
The equation is . Confirm with a third point: at , . ✓
Any two lattice points give the same slope. Using and instead: rise , run , . Same answer, which is exactly what "constant rate of change" means.
From a table: divide the change in by the change in
Find by comparing two rows:
Find from the row where , if there is one.
Here increases by and increases by , so . The row gives . The equation is . Check the last row: . ✓
When the table has no row
Find first, then walk back to one step at a time, undoing at each step.
Each step of in raises by , so . Stepping back from means going left and therefore down : at , . So and the equation is . Check a row that was given: . ✓
The other route is substitution. With known, put the known point into : , so . Same answer, and this is the method that carries into Algebra I.
The number-one error here is reporting the two numbers in the wrong slots. From the table above, "" or ""-style mix-ups come from grabbing whichever number is handy. Name each one out loud: this is the change per step, so it multiplies ; that is the value at , so it stands alone.
Worked examples
Example 1 — From a graph
A line crosses the -axis at and passes through . Write its equation.
. From to : rise , run , so .
Answer:
Example 2 — From a table with
Write the equation for the table with and .
Each step of in lowers by , so . At , , so .
Answer: . Check: . ✓
Example 3 — From a table with a fractional slope
Write the equation for the table with and .
Change in is , change in is , so . At , , so .
Answer: . Check: . ✓
Example 4 — From a table with no row
Write the equation for the table with and .
Change in is , change in is , so . Substituting the point :
Answer: . Since , this one is proportional. Check: . ✓
Example 5 — From a description
A line has slope and passes through . Write its equation.
The given point is on the -axis, so it is the y-intercept: .
Answer:
Example 6 — Two students, two slope triangles
One student reads a graph using and ; another uses and . Show that they get the same equation.
First: . Second: . Both read from the axis crossing.
Answer: Both get . The slope of a line does not depend on which two of its points you count between.
Guided practice
- Write the equation of the line in the figure for this lesson.
- Write the equation of the line graphed in Lesson 8.2, which crosses the -axis at and passes through .
- Write the equation for the table with and .
- Write the equation for the table with and .
- A line passes through and . Write its equation.
- Write the equation for the table with and .
Independent practice
- Write the equation of the line through each pair of points. a) and b) and c) and d) and
- Write the equation for the table with and .
- Write the equation for the table with and .
- Write the equation for the table with and . Explain how you found when no row shows .
- Write the equation for the table with and , and say whether the relationship is proportional.
- A line has slope and passes through . Write its equation.
- Application. A printing shop charges a flat $8 setup fee plus $2 per shirt. Write the equation and find the cost of shirts.
- Application. A tank holds gallons and loses gallons every minute. Write the equation and find how many minutes pass before the tank is empty.
- Reasoning. Two students read the same graph. One counts between and ; the other between and . Show that both produce the same equation, and explain why that had to happen.
- Error analysis. From the table with and , a student writes . Identify the error and give the correct equation.
Exit ticket 8.5
- Write the equation of the line with slope through .
- Write the equation for the table with and .
- A line passes through and . Write its equation.
- Explain how to find from a table whose -values do not include .
Lesson 8.6 — Linear Functions in Context
What and mean when the numbers mean something
Once a linear function models a real situation, both key characteristics get a job description.
- is the starting amount — the value of the dependent variable when the independent variable is , before any counting has happened. A joining fee, a delivery charge, the water already in the pool, the height of the candle before it is lit.
- is the rate — how much the dependent variable changes for each one unit of the independent variable. Dollars per hour, liters per minute, members per week. A positive means something is being added; a negative means something is being used up.
The units are the giveaway. A quantity measured "per" something is ; a one-time quantity with no "per" is .
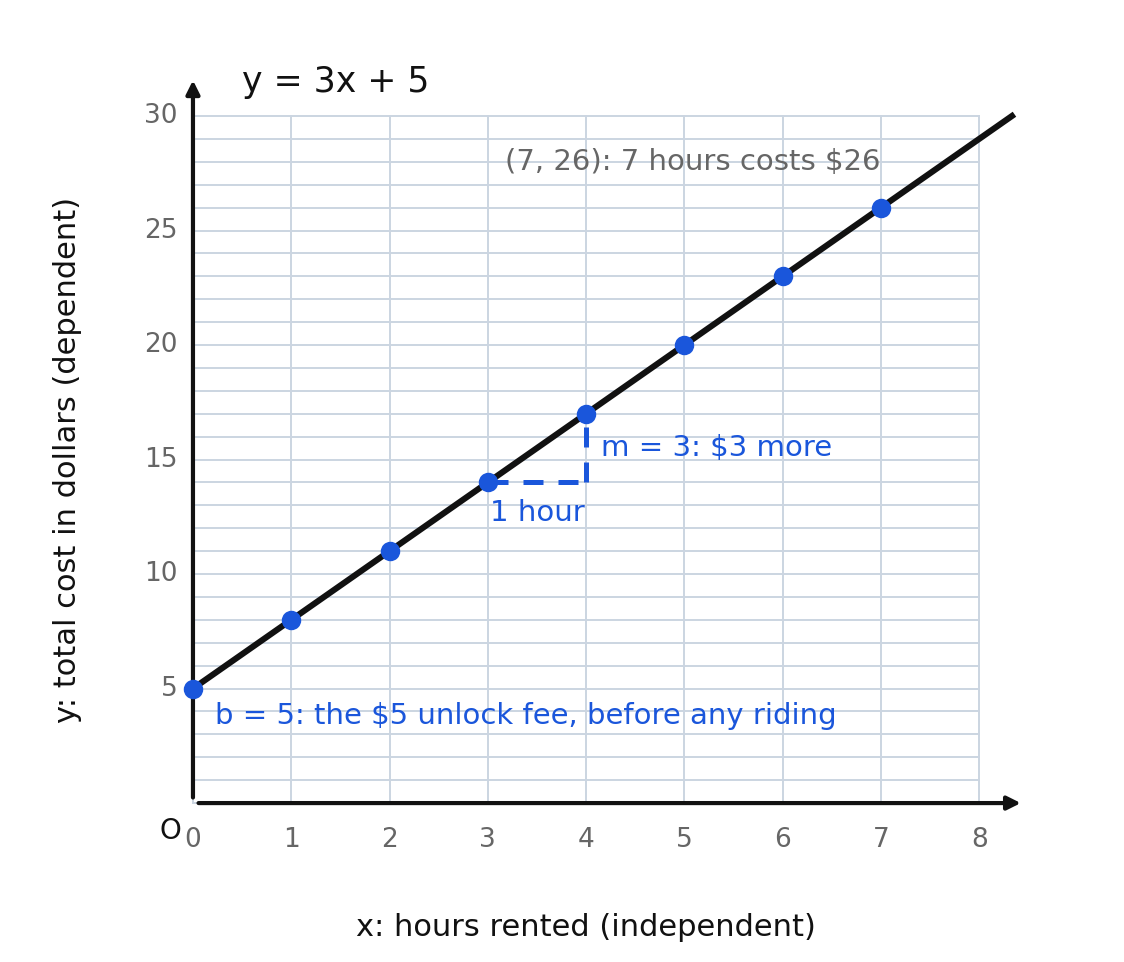
A bike shop charges $5 to unlock a bike plus $3 for each hour of riding, so , where is hours (independent) and is total cost in dollars (dependent). The point is the $5 before any riding at all. Every step right of hour steps up $3. The cost of hours is dollars.
Negative rates and the point where the story ends
When something is being used up, is negative and the line falls.
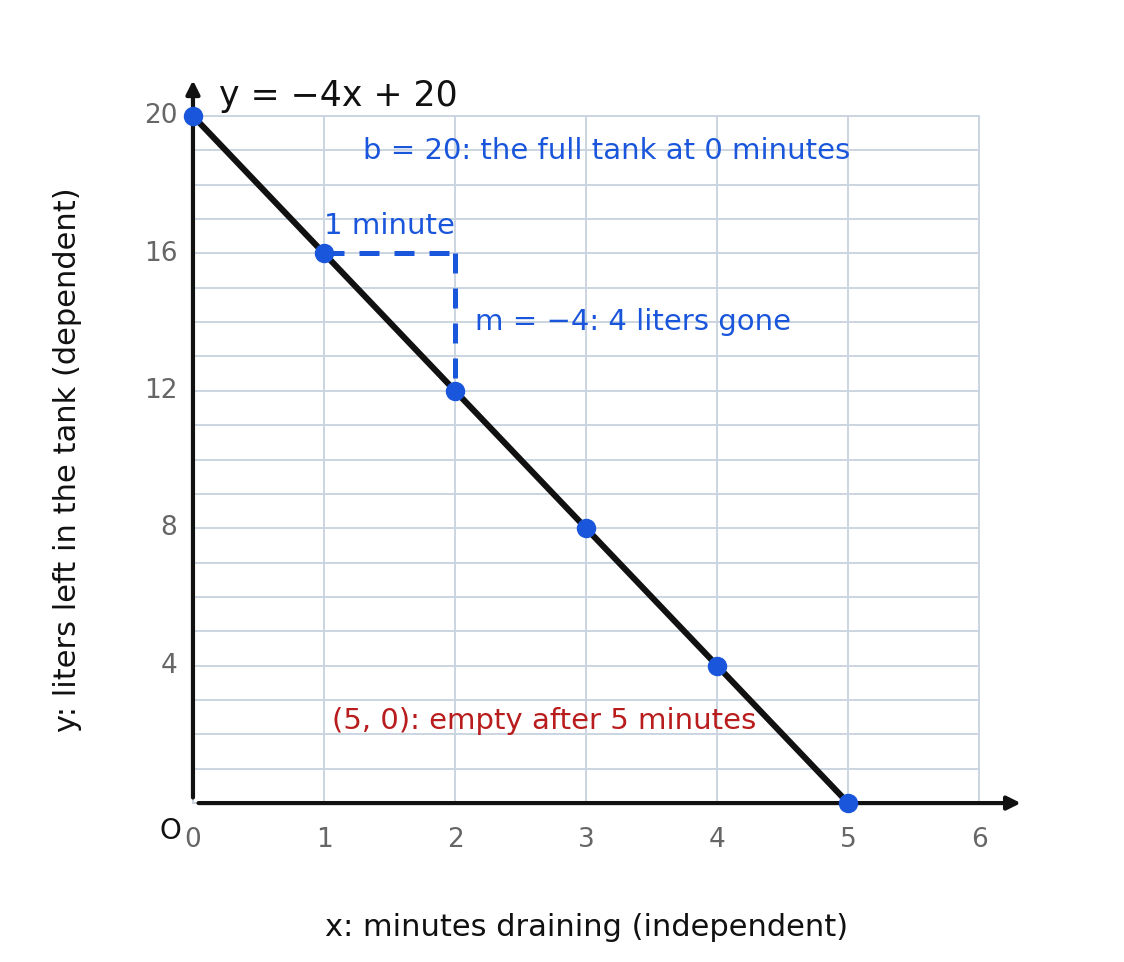
A tank holds liters and drains liters a minute: . Here is the full tank and liters per minute is the drain rate. The point matters: it says the tank is empty after minutes.
That point also bounds the story. Mathematically the function keeps going and produces at , but a tank cannot hold liters. Likewise would be two minutes before the valve opened, which the story does not describe. A context restricts which inputs make sense, even though the equation itself does not.
Moving among all four representations
The standard asks you to travel in every direction: context to equation, equation to table, table to graph, graph back to context. In practice one question often asks for all of them.
A gym charges $20 to join plus $12 per month.
- Equation: , where is months and is total dollars paid.
- Table:
| (months) | |||||
|---|---|---|---|---|---|
| (dollars) |
- Graph: start at ; each month steps right and up .
- Answering a question: ten months costs dollars.
Comparing two situations
Two plans with the same rate but different starting amounts, and , produce parallel lines. The second is always $15 more, at every value of , because . That is Lesson 8.1's translation showing up as a sentence about money.
Worked examples
Example 1 — Context to equation
A lawn service charges $12 to show up plus $9 per hour of work. Write the function and name both variables.
The $9 is "per hour," so it is ; the $12 happens once, so it is .
Answer: , where (hours worked) is the independent variable and (total charge in dollars) is the dependent variable.
Example 2 — Interpreting a point
For in the bike-rental story, what does the point mean?
Check it first: . ✓
Answer: Renting for hours costs $17.
Example 3 — A decreasing quantity
A drone hovers at meters and descends meters per second. Write the function, make a table for to , and say when it lands.
Starting height is ; descending per second makes . So .
| (seconds) | ||||||
|---|---|---|---|---|---|---|
| (meters) |
Answer: ; the drone reaches the ground at seconds, where .
Example 4 — Which number is the rate?
A shipping company charges a $6 handling fee plus $4 per package. A student writes . Correct it.
"Per package" attaches to the count of packages, so is the coefficient of . The $6 is charged once, so it is the constant.
Answer: . Test it on one package: dollars, which is one $4 package plus the $6 fee. The student's version would charge $10 for one package too but $16 for two, when the true cost is .
Example 5 — Reading a graph in context
From the draining-tank graph, how much water is left after minutes, and how does the equation confirm it?
The line passes through the lattice point , and . ✓
Answer: liters.
Guided practice
- In the bike-rental graph (), what is , and what does it mean in the story?
- In the same graph, what is , and what does it mean in the story?
- Use to find the cost of renting for hours.
- In the draining-tank graph (), what does the point mean?
- A lawn service charges $12 to show up plus $9 per hour. Write the function.
- Name the independent and dependent variables in item 105.
Independent practice
- A gym charges $20 to join plus $12 per month. a) Write the function. b) Make a table for through . c) Find the total paid after months.
- A drone hovers at meters and descends meters per second. a) Write the function. b) Make a table for through . c) Find when the drone reaches the ground.
- A book club has members and adds members every week. Write the function, graph it from to , and find the membership after weeks.
- A taxi charges $3 plus $2 per mile. Make a table for through miles, and state which column holds the independent variable.
- Use the bike-rental graph to find the cost of hours, then confirm your answer with the equation.
- Reasoning. In for the bike rental, explain why does not make sense even though the equation accepts it.
- Reasoning. Two plans cost and dollars. Which is always more expensive, by how much, and what do the two graphs look like together?
- Application. A phone plan costs $30 per month plus $5 per gigabyte of data. Write the function, make a table for through gigabytes, and find the bill for a month using gigabytes.
- Application. A candle is centimeters tall and burns centimeters per hour. Write the function, find its height after hours, and find when it burns out.
- Error analysis. For "a $6 handling fee plus $4 per package," a student writes . Correct the equation and explain the test that tells you which number multiplies .
Exit ticket 8.6
- A pool already holds inches of water and rises inches per hour. Write the function.
- Make a table for item 117 at .
- What does the y-intercept mean in item 117?
- Explain how you decide, in a word problem, which number is and which is .
Lesson 8.7 — Creating a Context for a Linear Function
The task, and why it is not backwards busywork
Every lesson so far started with a situation and produced mathematics. This one goes the other direction: you are handed , a table, or a graph, and you invent a plausible real-world context that it could describe. The standard asks for this by name, and it is the best evidence that you understand what and are rather than where they sit in the equation.
A four-question recipe
1. What does count? Pick something that increases in steps: hours, weeks, miles, packages, days, guests.
2. What does measure? Pick something that depends on : dollars, liters, centimeters, members, points.
3. What is ? The amount of that already exists when — before any hours pass, before any miles are driven. A fee, a starting balance, an initial height, a current membership.
4. What is ? The amount of added for each one more . If is negative, your story has to remove that much per step, so choose something that shrinks: a candle burning, a tank draining, a balance being spent down.
Then check it by substituting one value and reading the result as a sentence. If the sentence is nonsense, the story does not fit.
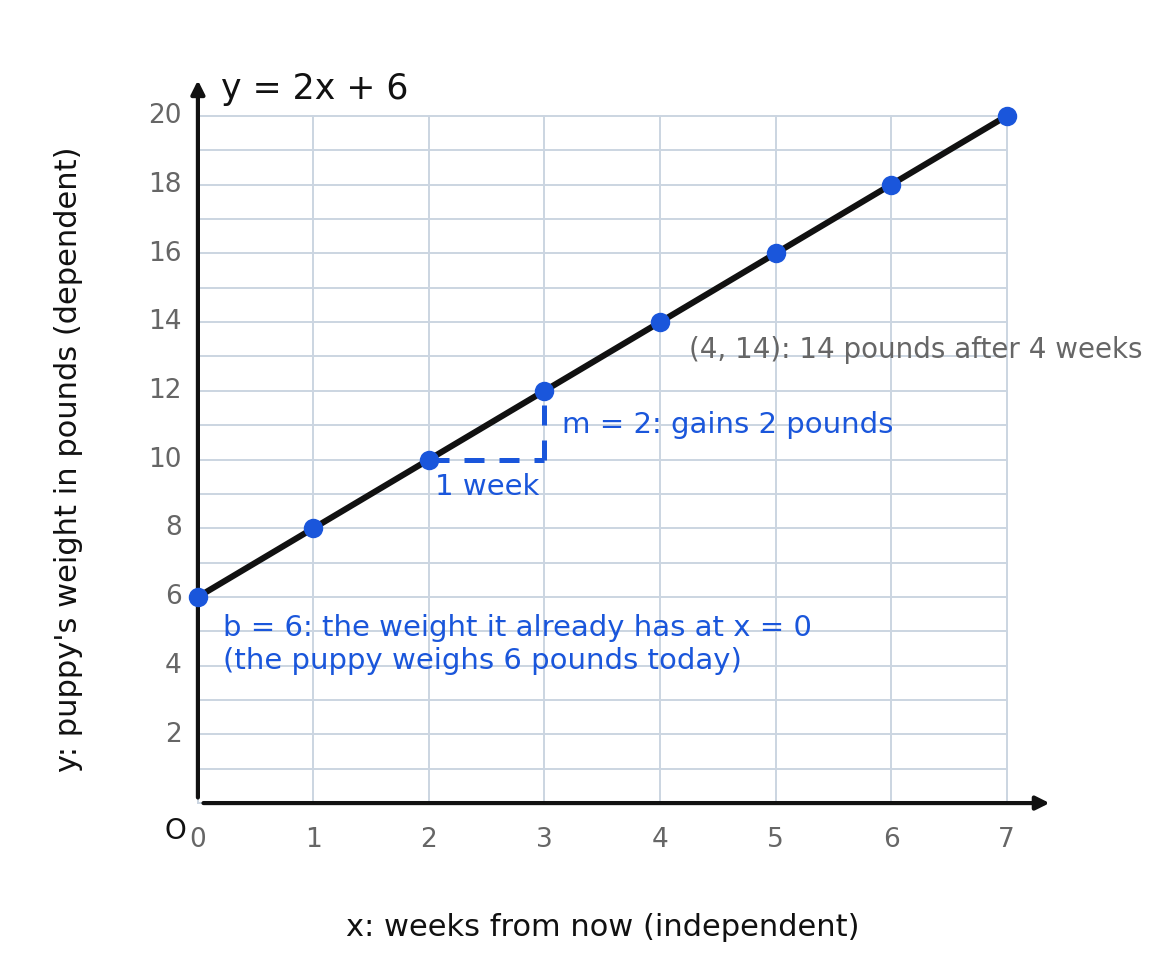
Take . Here and .
A puppy weighs pounds today and gains pounds each week. Let be the number of weeks from now and the puppy's weight in pounds.
Check: at , , and the story says the puppy weighs pounds after weeks. That reads correctly, so the context fits.
The same equation, many stories
There is no single right answer, and it helps to see that plainly. All three of these fit :
- A saver has $6 and adds $2 a week; is dollars saved after weeks.
- A club has members and gains members a month; is members after months.
- A plant is centimeters tall and grows centimeters a week; is height after weeks.
What they share is the structure: something starts at 6 and grows by 2 per step. Any story with that structure is acceptable. A story where $6 is charged per week is not, because that would make the rate.
Fractional rates in a story
When is a fraction, say it as a rate over more than one unit. For :
A -centimeter candle burns centimeter every hours.
That is wrong in one way — a burning candle shrinks — so the sign has to match. For the candle story works, and for you need something that grows half a unit per step: a plant that gains centimeter every weeks, starting at centimeters.
Starting from a table or a graph
If you are handed a table or a graph instead of an equation, write the equation first with Lesson 8.5's method, then run the four questions.
From the table with : and , so . A context: a photographer charges $12 to book plus $3 per printed photo, where is photos and is total dollars.
The two errors to avoid
Swapping and . For , "a gym charges $7 to join and $15 each month" describes . Ask which number carries "per."
Ignoring the sign of . For , a story about saving money each week cannot be right; the quantity has to be decreasing, so spend $3 a week from $12 instead.
Worked examples
Example 1 — A positive rate
Write a context for .
starts the story; is added per step.
Answer: A student has $20 and earns $5 for each dog she walks. Let be dogs walked and the total dollars she has. Check: gives , meaning $35 after three dogs. ✓
Example 2 — A negative rate
Write a context for and say what the -intercept means.
Something must decrease by per step from .
Answer: A phone battery is at percent and loses percentage points every minute of video; is minutes and is percent remaining. Since , the point means the battery dies after minutes.
Example 3 — Proportional,
Write a context for .
Here : nothing exists before counting starts.
Answer: A worker earns $8 per hour with no signing bonus; is hours worked and is dollars earned. At the pay is $0, which matches .
Example 4 — A fractional rate
Write a context for in which counts days.
A slope of means one unit gained every two days.
Answer: A seedling is centimeters tall and grows centimeter every days; is its height in centimeters after days. Check: at , , and three growth spurts of centimeter over six days gives . ✓
Example 5 — From a graph
A line passes through and has slope . Write a context and interpret the point .
The equation is .
Answer: A cook starts with cups of flour and uses cups per batch of biscuits; is batches and is cups left. The point means that after two batches, cups of flour remain. The flour runs out at .
Example 6 — Repairing a bad context
For , a student writes: "A gym charges $7 to join and $15 each month." Fix it.
The $15 is written as the monthly rate, but in the equation the monthly rate multiplies , and that coefficient is .
Answer: A gym charges $15 to join plus $7 each month; is months and is total dollars paid. Check: after months, dollars, which is $15 plus two $7 payments. ✓
Guided practice
For each item, name what counts, what measures, and what and mean in your story.
- Write a context for .
- Write a context for . It must describe something decreasing.
- For , name a real-world quantity that could be.
- For , explain what the negative slope has to mean in your story.
- Using the annotated graph of in this lesson, write a context and check it at one value of .
- Explain why any context for must involve something that starts at .
Independent practice
- Write a context for each function. a) b) c) d)
- Write a context for the function shown by the table with and . Write the equation first.
- A line passes through with slope . Write the equation, then write a context, then say what the -intercept means in your story.
- Write a context for , then use your story to say what happens at .
- Write two different contexts for — one about money and one not about money.
- Reasoning. Explain why a context for has to describe something that runs out, and state the -value where it does.
- Reasoning. "A car travels miles per hour" fits . Explain what would have to be added to the story for to fit instead.
- Application. Write a context for and use it to explain what the point means.
- Application. Write a context for in which counts days. Say what happens at .
- Error analysis. For , a student writes: "A gym charges $7 to join and $15 each month." Explain the error and give a corrected context.
Exit ticket 8.7
- Write a context for , naming both variables.
- Write a context for and state what the -intercept means in it.
- In your context for item 137, what does the point mean?
- State the two questions you should ask yourself first when inventing a context for .
Chapter 8 Review
Vocabulary. proportional relationship · linear function · slope-intercept form · slope · rate of change · rise · run · y-intercept · translation · parallel · independent variable · dependent variable · table of values · lattice point · x-intercept · context
Part A — Adding a constant translates (8.PFA.3a)
- Describe how the graph of is related to the graph of .
- Write the equation of the line produced by translating up units.
- Explain why the graphs of and are parallel.
- Copy and complete the table, then state how the two output columns are related.
- Does a vertical translation change , change , or change both? Explain.
Part B — Key characteristics of a linear function (8.PFA.3b)
- Name and for each. a) b) c) d)
- Does the graph of rise or fall from left to right?
- The amount of gasoline left in a tank depends on the number of miles driven. Name the independent and the dependent variable.
- Which is steeper, or ? Justify your answer.
- Explain what tells you about the position of a graph, and give the ordered pair it names.
Part C — Graphing a linear function (8.PFA.3c)
- Graph and list three points with integer coordinates.
- Graph and list three points with integer coordinates.
- Graph and list three points with integer coordinates.
- A jug holds liters and a pump adds liters per minute. Write the function and graph it from to .
- Graph and list three points with integer coordinates.
Part D — Tables of values (8.PFA.3d)
- Make a table for at .
- Choose four -values that give integer outputs for and complete the table.
- Make a table for at .
- Is the table with and linear? Show the test you used.
Part E — Writing (8.PFA.3e)
- Write the equation of the line through and .
- Write the equation for the table with and .
- Write the equation for the table with and .
- A well holds gallons and a pump removes gallons per hour. Write the function and find when the well is empty.
- Write the equation of the line with slope through .
Part F — Creating a context (8.PFA.3f)
- Write a context for , naming both variables and what and mean.
- Write a context for and state what the -intercept means in it.
- Write a context for the function shown by the table with and . Give the equation first.
- Write a context for in which counts days.
Part G — Mixed application and reasoning
- For : name and , make a table for through , graph it, and describe how its graph is related to the graph of .
- Represent four ways: the equation, a table for , a graph, and a context.
- Error analysis. To graph , a student starts at and moves up and right . Explain the error, name the slope the student actually used, and give the correct first step.
- Reasoning. Two linear functions both have slope . One passes through and the other through . Compare their graphs and name the translation that maps the first onto the second.
Standards coverage check — Chapter 8
| Knowledge and Skill | Where it is taught | Where it is practiced |
|---|---|---|
| 8.PFA.3a — determine how adding a constant to the equation of a proportional relationship will translate the line on a graph | 8.1 (figures 1 and 2); revisited in 8.6 when two plans differ only by a fee | Items 1–20; 52; 113; Review Part A, items 141–145; items 169, 172 |
| 8.PFA.3b — describe key characteristics of linear functions including slope (), y-intercept (), and independent and dependent variables | 8.2 (figures 3 and 5); the variable roles are re-named in every context lesson | Items 21–40; 101, 102, 106, 110, 119; Review Part B, items 146–150; item 169 |
| 8.PFA.3c — graph a linear function given a table, equation, or a situation in context | 8.3 (figure 4), 8.4 (figure 6, table to graph), 8.6 (figures 8 and 9) | Items 41–60; 64, 71; 109; Review Part C, items 151–155; items 169, 170 |
| 8.PFA.3d — create a table of values for a linear function given a graph, equation in the form , or context | 8.4 (figure 6); tables built from contexts in 8.6 | Items 12, 61–80; 107b, 108b, 110, 114, 118; Review Part D, items 156–159; items 169, 170 |
| 8.PFA.3e — write an equation of a linear function in the form , given a graph, table, or a situation in context | 8.5 (figure 7); context-to-equation in 8.6 | Items 81–100; 105, 107a, 108a, 114–117; Review Part E, items 160–164; items 169, 170 |
| 8.PFA.3f — create a context for a linear function given a graph, table, or equation in the form | 8.7 (figure 10) — a four-question recipe, several stories for one equation, fractional and negative rates, and the two standard errors | Items 121–140; Review Part F, items 165–168; item 170 |
Every plotted ordered pair in this chapter has integer coordinates and every y-intercept is an integer, as the standard requires. Fractional slopes appear throughout, and Lesson 8.4 teaches the habit that keeps them compatible with that limit: choose -values that are multiples of the denominator of .
Answer keys for every set in this chapter are in Appendix A.