Chapter 7 — Proportional Relationships: Tables, Graphs, and
Standard: 7.PFA.1 — The student will investigate and analyze proportional relationships between two quantities using verbal descriptions, tables, equations in form, and graphs, including problems in context.
By the end of this chapter you will be able to:
- Determine the slope as the rate of change in a proportional relationship from a table, a graph, or a situation, and write the equation (7.PFA.1a)
- Identify and describe a line whose slope is positive, negative, or zero from its graph (7.PFA.1b)
- Graph a proportional relationship given one ordered pair on the line and the slope (7.PFA.1c)
- Graph a proportional relationship given its equation in the form (7.PFA.1d)
- Move between and among a context, a table, an equation, and a graph of the same proportional relationship (7.PFA.1e)
Lessons: 7.1 Rate of Change as Slope · 7.2 Finding Slope from a Table · 7.3 Writing from a Table, Graph, or Situation · 7.4 Positive, Negative, and Zero Slope · 7.5 Graphing a Proportional Relationship · 7.6 Connecting All Four Representations
Lesson 7.1 — Rate of Change as Slope
One quantity changing with another
In Chapter 5 you worked with proportional relationships using ratio tables and proportions. This chapter takes the same idea and gives it a picture and an equation.
Start with a familiar situation. A car travels at a steady 55 miles per hour. Every hour that passes, the odometer gains 55 miles. That "55 miles for each 1 hour" is the rate of change of distance with respect to time: how much one quantity changes for each one-unit change in the other.
When the rate of change never varies — the same 55 miles every hour, not 60 in one hour and 48 in the next — we call it a constant rate of change. Constant rate of change is exactly what makes a relationship proportional, and it is what makes the graph a straight line.
Slope
For a straight line, the constant rate of change has a name: slope. We use the letter for slope. Slope compares vertical change to horizontal change:
The rise is how far you move up or down. The run is how far you move right. If you move up, the rise is positive; if you move down, the rise is negative. We always read a graph left to right, so the run is positive.
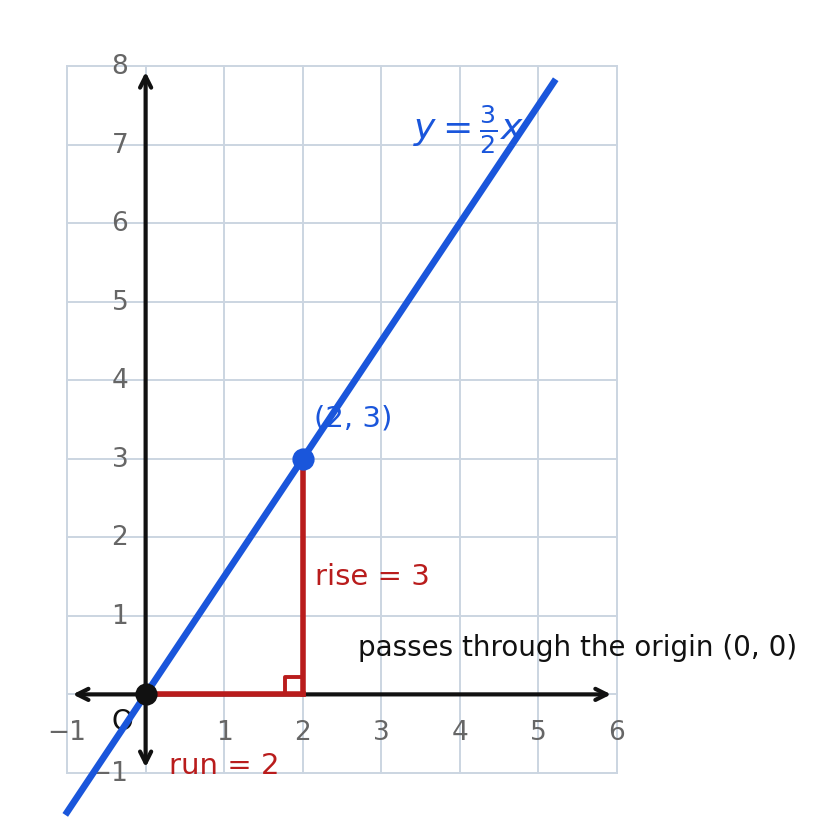
The right triangle drawn under the line is called a slope triangle. Its horizontal leg is the run and its vertical leg is the rise. Here the run is 2 and the rise is 3, so
Read that as "the line rises 3 units for every 2 units you move right," or, more usefully, " increases by for every increase of 1 in ."
The origin is not optional
Look again at the figure. The line passes through the point , the origin. That is not a coincidence — it is a requirement.
In a proportional relationship, is always the same fixed multiple of . When is 0, that multiple of 0 is 0, so must be 0 as well. Zero hours of driving means zero miles. Zero pounds of apples costs zero dollars.
The test that never fails. The graph of a proportional relationship is a straight line through the origin. If a straight line misses the origin, the relationship it shows is not proportional. You will meet those lines in Grade 8; for now, missing the origin is a disqualifier.
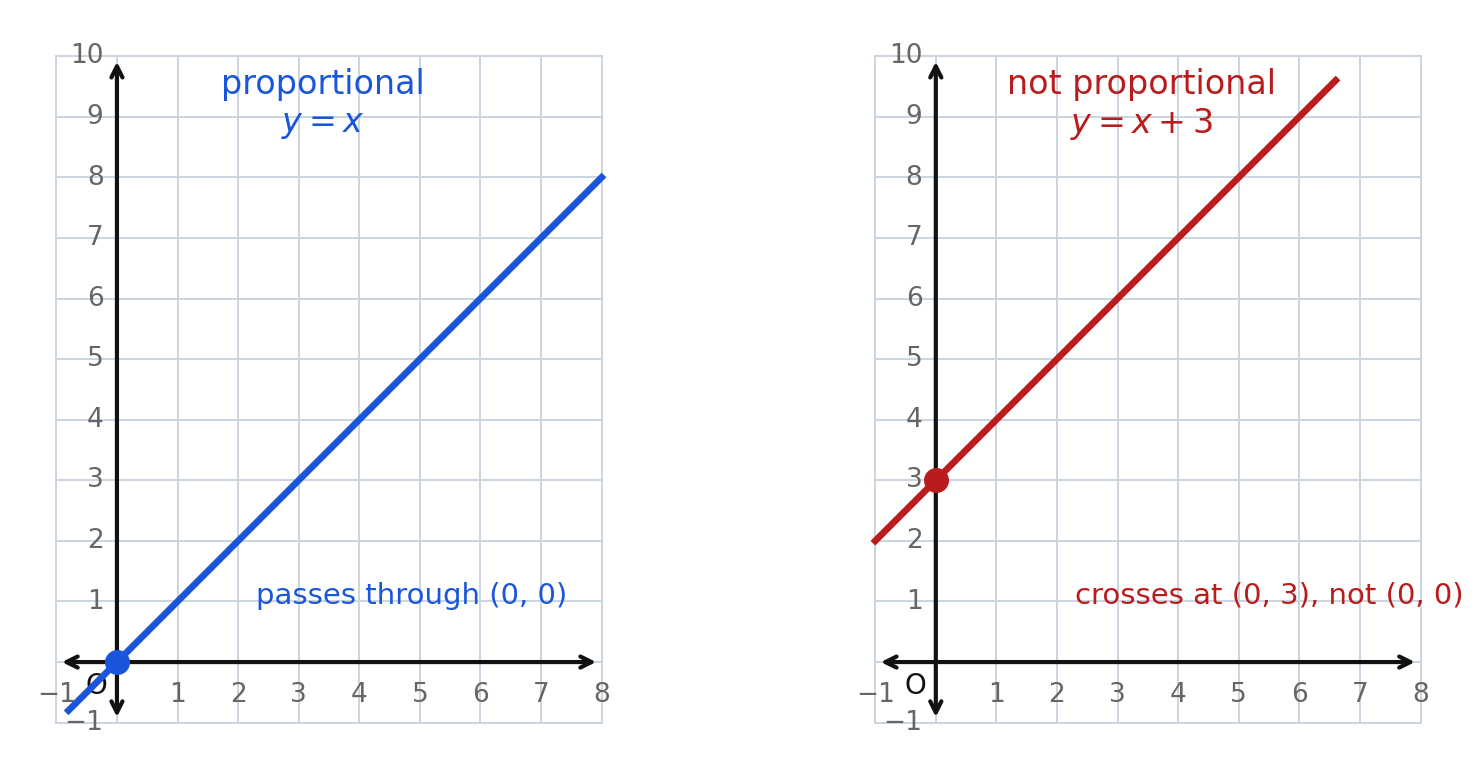
Both lines above are straight and both climb at the same steady rate. Only the left one is proportional, because only the left one starts at .
Any slope triangle gives the same slope
You may wonder whether the answer depends on where you draw the slope triangle. It does not, and that fact is worth seeing.
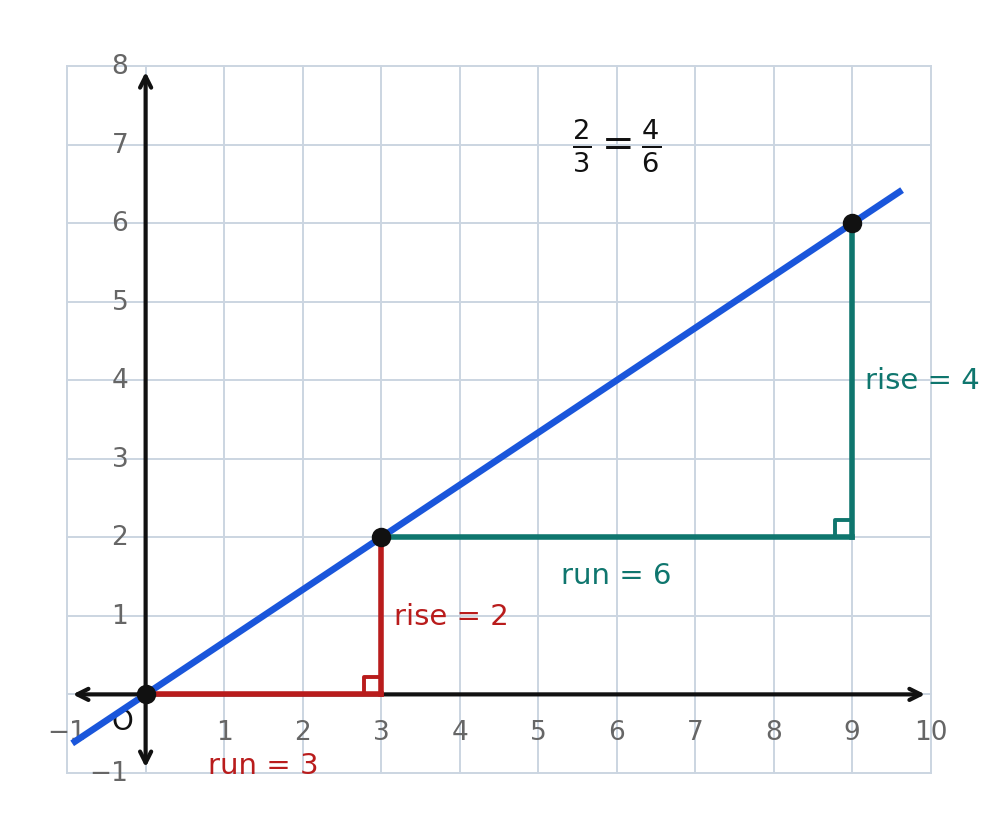
The small triangle gives . The large triangle gives , which simplifies to . Same line, same slope. This is the constant rate of change showing up as a picture: no matter which stretch of the line you measure, the ratio of rise to run is identical.
Slope is the unit rate
If you have a context, the slope is the unit rate you already know how to find. A landscaper who charges $45 for 1 hour of work has a slope of 45 dollars per hour. A recipe using 3 cups of flour for every 2 loaves has a slope of cups per loaf.
To find the slope from a context, divide the way you would to find any unit rate:
Always attach the units, in the order "-units per -unit." Slope with no units is a number; slope with units is information.
Slope in context is positive. Throughout this chapter, whenever a problem describes a real situation, the slope will be positive. Negative slopes are perfectly good mathematics and you will work with them in abstract problems — lines, tables, and equations with no story attached — but the contextual problems here all describe quantities that grow together.
Worked examples
Example 1 — Rate of change from a situation
A delivery van travels 165 miles in 3 hours at a steady speed. Find the rate of change of distance with respect to time.
Divide the distance by the time to reach the amount for 1 hour.
Answer: 55 miles per hour
Example 2 — Slope from a graph using a slope triangle
A line passes through the origin and through . Find its slope.
Move from to . The run is and the rise is .
Answer:
Example 3 — Slope from two points that are not the origin
A line passes through and . Find its slope.
Run: . Rise: .
Answer:
Example 4 — A negative slope
A line passes through the origin and through . Find its slope.
Run: . Rise: . The rise is negative because the line goes down as you move right.
Answer:
Example 5 — Slope as a unit rate
A bakery sells 6 bagels for $7.50. Find the slope of the relationship between bagels and cost.
Answer: , or $1.25 per bagel
Guided practice
- A line passes through the origin and through . Find its slope.
- A line passes through the origin and through . Find its slope.
- A slope triangle on a line has a rise of 6 and a run of 4. Find the slope, in simplest form.
- A slope triangle on a line has a rise of and a run of 1. Find the slope.
- A faucet fills 12 gallons in 4 minutes at a steady rate. Find the rate of change, with units.
Independent practice
- Find the slope for each rise and run. a) rise 10, run 2 b) rise 3, run 12 c) rise , run 4 d) rise 7, run 7
- A line passes through the origin and through . Find its slope.
- A line passes through the origin and through . Find its slope.
- A line passes through and . Find its slope in simplest form.
- Explain why the slope of a proportional relationship is the same number as its unit rate.
- Application. A printing press prints 1,500 pages in 6 minutes at a steady rate. Find the rate of change with units, then find how many pages it prints in 10 minutes.
- Reasoning. Jae says the slope of the line through the origin and is . Explain the mistake and give the correct slope.
Exit ticket 7.1
- A line passes through the origin and through . Find its slope.
- A slope triangle has a rise of and a run of 2. Find the slope.
- A hose delivers 45 liters in 5 minutes at a steady rate. Find the rate of change, with units.
- Explain in your own words what rate of change means, and why it stays constant in a proportional relationship.
Lesson 7.2 — Finding Slope from a Table
Checking that a table is proportional
A table of values is proportional only if is the same multiple of in every single row. That gives you a test you can run in a few seconds:
Divide by in every row. If you get the same quotient every time, the relationship is proportional, and that quotient is the slope .
Here is the test on a table:
| 1 | 2 | 3 | 4 | |
|---|---|---|---|---|
| 2 | 4 | 6 | 8 |
, , , . Every row gives 2, so the relationship is proportional with slope .
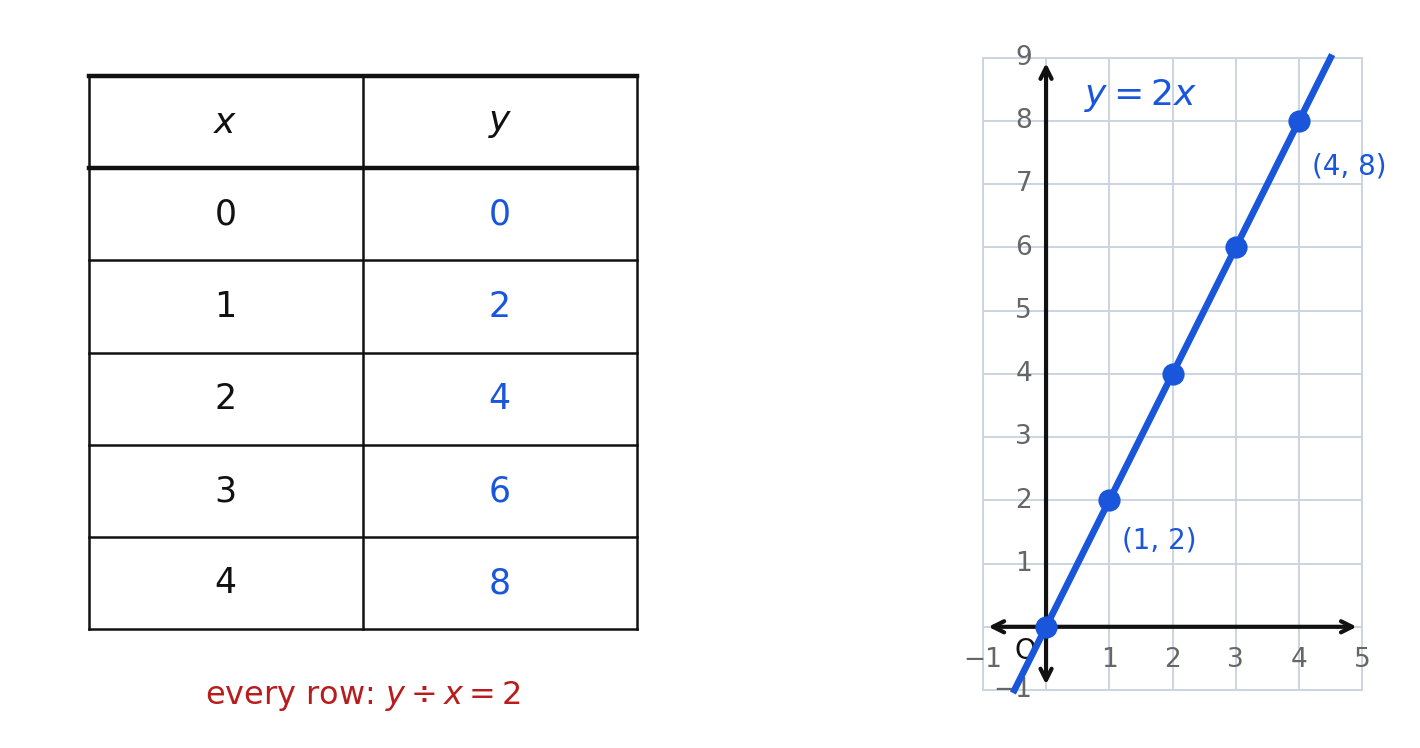
Every row of the table becomes one point on the graph, and all of those points fall on one straight line through the origin. That is the same fact told twice.
Notice one row you can always add for free: pairs with . A proportional table can always be extended to include the origin.
When the table skips around
Tables do not always start at 1 and count up. This one jumps:
| 2 | 5 | 8 | |
|---|---|---|---|
| 5 | 12.5 | 20 |
Run the test anyway: , , . Proportional, with .
You can also find the slope from any two rows using change in over change in :
Both methods must agree when the table is proportional. If they disagree, the table is not proportional and you have caught it.
A table that is not proportional
| 1 | 2 | 3 | |
|---|---|---|---|
| 5 | 9 | 13 |
The -values do rise by a steady 4 each time, so the points do fall on a straight line. But while . Different quotients, so this relationship is not proportional. If you extended the table back to you would get , not — the line misses the origin.
Steady differences are not enough. A constant jump in tells you the points are on a line. Only equal quotients tell you that line passes through the origin. Check the quotients.
Worked examples
Example 1 — Slope from a simple table
| 1 | 2 | 3 | 4 | |
|---|---|---|---|---|
| 7 | 14 | 21 | 28 |
, , , .
Answer: Proportional,
Example 2 — A table with decimals
| 2 | 5 | 8 | |
|---|---|---|---|
| 5 | 12.5 | 20 |
, , .
Answer: Proportional,
Example 3 — A negative slope in a table
| 1 | 2 | 3 | 4 | |
|---|---|---|---|---|
, , , .
Answer: Proportional,
Example 4 — Deciding a table is not proportional
| 1 | 2 | 3 | |
|---|---|---|---|
| 5 | 9 | 13 |
but . The quotients differ.
Answer: Not proportional, so it has no single slope of the form
Example 5 — Using change in over change in
| 4 | 10 | |
|---|---|---|
| 6 | 15 |
Check with the quotients: and . They agree.
Answer: Proportional,
Guided practice
- Find the slope of the proportional relationship in the table.
| 1 | 2 | 3 | 4 | |
|---|---|---|---|---|
| 9 | 18 | 27 | 36 |
- Find the slope.
| 2 | 4 | 6 | |
|---|---|---|---|
| 1 | 2 | 3 |
- Find the slope.
| 1 | 2 | 3 | |
|---|---|---|---|
- Find the slope.
| 3 | 6 | 9 | |
|---|---|---|---|
| 12 | 24 | 36 |
- Is this relationship proportional? Show the quotients you used to decide.
| 1 | 2 | 3 | |
|---|---|---|---|
| 4 | 7 | 10 |
Independent practice
- Each table is proportional. Find the slope of each. a) : 2, 4, 6 and : 7, 14, 21 b) : 5, 10, 15 and : , , c) : 4, 8, 12 and : 3, 6, 9
- Find the slope.
| 0 | 1 | 2 | 3 | |
|---|---|---|---|---|
| 0 | 2.5 | 5 | 7.5 |
- This relationship is proportional. Find the slope, then fill in the missing value.
| 1 | 2 | 3 | 4 | |
|---|---|---|---|---|
| 6 | 12 | ? | 24 |
- One of these tables is proportional and one is not. Name which is which and explain how you decided. Table 1 — : 1, 2, 3 and : 3, 6, 9 Table 2 — : 1, 2, 3 and : 3, 5, 7
- A proportional table contains the rows and . Find the slope two ways: by dividing by , and by using change in over change in .
- Application. A part-time job pays at a steady rate. The table shows hours worked and dollars earned.
| Hours | 3 | 5 | 8 |
|---|---|---|---|
| Dollars | 46.50 | 77.50 | 124.00 |
Show that the relationship is proportional, give the slope with units, and find the earnings for 12 hours.
- Reasoning. Explain how you can tell from a table alone whether a relationship is proportional, and explain why checking only one row is not enough.
Exit ticket 7.2
- Find the slope.
| 1 | 2 | 3 | 4 | |
|---|---|---|---|---|
| 11 | 22 | 33 | 44 |
- Find the slope.
| 4 | 8 | 12 | |
|---|---|---|---|
- Is this relationship proportional? Explain.
| 2 | 4 | 6 | |
|---|---|---|---|
| 5 | 10 | 16 |
- Explain why dividing by in every row is a valid test for proportionality.
Lesson 7.3 — Writing from a Table, Graph, or Situation
The equation of a proportional relationship
Every proportional relationship can be written in one compact form:
Read it as " equals times ." The number is the slope, the constant rate of change. The relationship is also called a direct variation, and we say " varies directly with ."
Three things are packed into that short equation:
- The multiplier. Each is times its .
- The origin. Substituting gives , so is always a solution.
- A prediction machine. Give it any and it returns the matching , even values far beyond your table.
There is no number added on the end. A rule such as is a perfectly good equation, but it is not proportional: substituting gives , so the line misses the origin.
Writing the equation from each starting point
From a table. Divide by in any row to get , confirm the other rows give the same quotient, then write .
From a graph. Find one point on the line other than the origin, ideally one at a grid intersection. Its coordinates give . Then write .
From a situation. Find the unit rate — the amount of for exactly one unit of — and that is . Then say clearly what and stand for, including units. An equation without stated variables is only half an answer.
Using the equation
Once you have , two kinds of questions become one-step problems.
Given , find . Substitute and multiply. For with : .
Given , find . Substitute and divide. For with : , so .
Worked examples
Example 1 — Equation from a table
| 1 | 2 | 3 | |
|---|---|---|---|
| 8 | 16 | 24 |
, , , so .
Answer:
Example 2 — Equation from a graph
A line passes through the origin and through . Write its equation.
Answer: (equivalently )
Example 3 — Equation from a situation
Ground coffee costs $3.25 per pound. Write an equation for the cost.
The unit rate is 3.25 dollars per pound, so .
Let be the number of pounds and the cost in dollars.
Answer: , where is pounds and is dollars
Example 4 — A negative slope
A line passes through the origin and through . Write its equation.
Answer: (equivalently )
Example 5 — Using the equation both directions
For , find when , and find when .
Substitute : .
Substitute : , so .
Answer: ;
Guided practice
- Write for the table.
| 1 | 2 | 3 | |
|---|---|---|---|
| 4 | 8 | 12 |
- A line passes through the origin and through . Write its equation.
- A worker earns $14 per hour. Write an equation for the earnings, and say what and stand for.
- A line passes through the origin and through . Write its equation.
- For , find when .
Independent practice
- Write for each proportional table. a) : 2, 4, 6 and : 9, 18, 27 b) : 5, 10, 15 and : 2, 4, 6 c) : 1, 2, 3 and : , ,
- A line passes through the origin and through . Write its equation.
- A line passes through the origin and through . Write its equation.
- For , find when , and find when .
- Application. A bus travels at a steady 55 miles per hour. Write an equation relating hours to miles . How far does it travel in 4.5 hours? How long does it take to travel 302.5 miles?
- Application. Almonds cost $6.40 per pound. Write an equation relating pounds to cost . Find the cost of 3.5 pounds, then find how many pounds you can buy with $40.
- Reasoning. A phone plan charges $20 per month plus $5 per gigabyte of data. Explain why the total cost cannot be written in the form , and name the one feature of that the plan violates.
Exit ticket 7.3
- Write for the table.
| 1 | 2 | 3 | |
|---|---|---|---|
| 15 | 30 | 45 |
- A line passes through the origin and through . Write its equation.
- A copier makes 40 copies per minute. Write an equation, then find the number of copies made in 7 minutes.
- Explain how to find from a graph when you are not given a table.
Lesson 7.4 — Positive, Negative, and Zero Slope
Reading direction from a graph
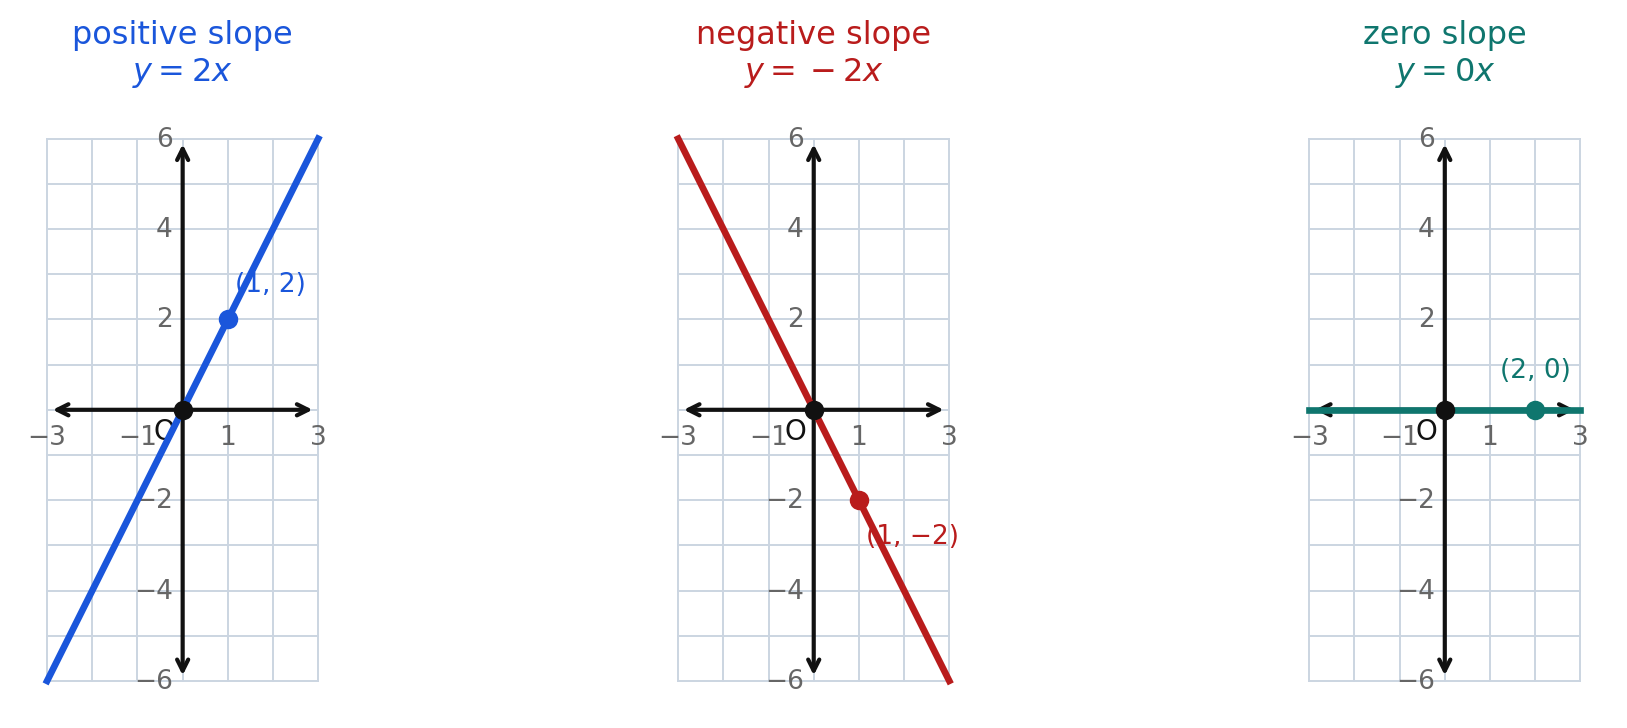
Always read a graph the way you read a sentence: left to right. Then the direction of the line tells you the sign of the slope before you calculate anything.
- Positive slope. The line rises from left to right. As increases, increases.
- Negative slope. The line falls from left to right. As increases, decreases.
- Zero slope. The line is horizontal. As increases, does not change at all.
Why the arithmetic matches the picture
Take a run of 1 in each case and look at the rise.
For , moving right 1 raises the line 2 units: , positive.
For , moving right 1 lowers the line 2 units: , negative.
For , moving right 1 changes nothing: .
The zero-slope case, precisely
The equation simplifies to . Every point on it has a -coordinate of 0: , , , . Plot them and you get a horizontal line lying exactly along the -axis. It passes through the origin, as every proportional relationship must.
Zero slope is horizontal, not vertical. A horizontal line has zero rise for any run, so its slope is . A vertical line has zero run, and division by zero is undefined, so a vertical line has no slope at all. Zero slope and no slope are different statements.
Steepness
The sign tells direction; the size of the number tells steepness. Compare and . The first climbs 4 units for every 1 across; the second climbs only of a unit. The larger the distance of from zero, the steeper the line — regardless of sign. So is steeper than , even though is the lesser number.
Direction in real situations
When a proportional relationship comes from a real context in this course, the slope is positive: more hours means more pay, more gallons means more miles, more minutes means more pages. The two quantities grow together, so the graph climbs from left to right and only the part in the first quadrant carries meaning. Negative slopes appear in abstract work — a line, a table, an equation with no story attached.
Worked examples
Example 1 — Classifying from an equation
Describe the slope of .
The coefficient of is 3, which is greater than zero.
Answer: Positive slope; the line rises from left to right.
Example 2 — A negative slope
Describe the slope of .
The coefficient is , which is less than zero.
Answer: Negative slope; the line falls from left to right, dropping 1 unit for every 2 units right.
Example 3 — Describing
Describe the graph of completely.
means for every .
Answer: Zero slope. It is a horizontal line lying along the -axis, containing points such as , , and .
Example 4 — Sign from a point in the second quadrant
A line passes through the origin and through . Find the slope and describe it.
Run: . Rise: .
Answer: , a negative slope; the line falls from left to right.
Example 5 — Comparing steepness
Which is steeper, or ?
Compare how far each is from zero: versus .
Answer: is steeper.
Guided practice
- Is the slope of positive, negative, or zero?
- Is the slope of positive, negative, or zero?
- Is the slope of positive, negative, or zero?
- A line passes through the origin and through . Find the slope and name its sign.
- A line passes through the origin and through . Find the slope.
Independent practice
- Classify each slope as positive, negative, or zero. a) b) c) d) a line through the origin and e) a line through the origin and
- Order these lines from least steep to steepest: , , .
- A line through the origin falls as you read it from left to right. What can you say about ?
- Describe the graph of in a complete sentence, and name three points on it.
- A line passes through the origin and through . Find the slope and name its sign. Be careful.
- Application. Snow falls at a steady 2 inches per hour. If you graph inches of snow against hours, will the slope be positive, negative, or zero? Explain why the slope of a graph like this one is positive.
- Reasoning. A classmate says a line with zero slope is a vertical line. Explain the error and describe what a zero-slope line actually looks like.
Exit ticket 7.4
- Is the slope of positive, negative, or zero?
- A line passes through the origin and through . Find the slope and name its sign.
- What does the graph of look like?
- Explain how you can decide the sign of a slope from a graph without doing any arithmetic.
Lesson 7.5 — Graphing a Proportional Relationship
Two points make a line
To draw a line you need only two points, and in a proportional relationship one of them is handed to you: the origin. That is the whole strategy.
Graphing from an equation :
- Plot the origin .
- Write as a fraction . A whole number becomes .
- From the origin, move right by the run and up or down by the rise. Plot that point.
- Repeat once more to get a third point as a check.
- Draw a straight line through the points, extending it in both directions with arrows.
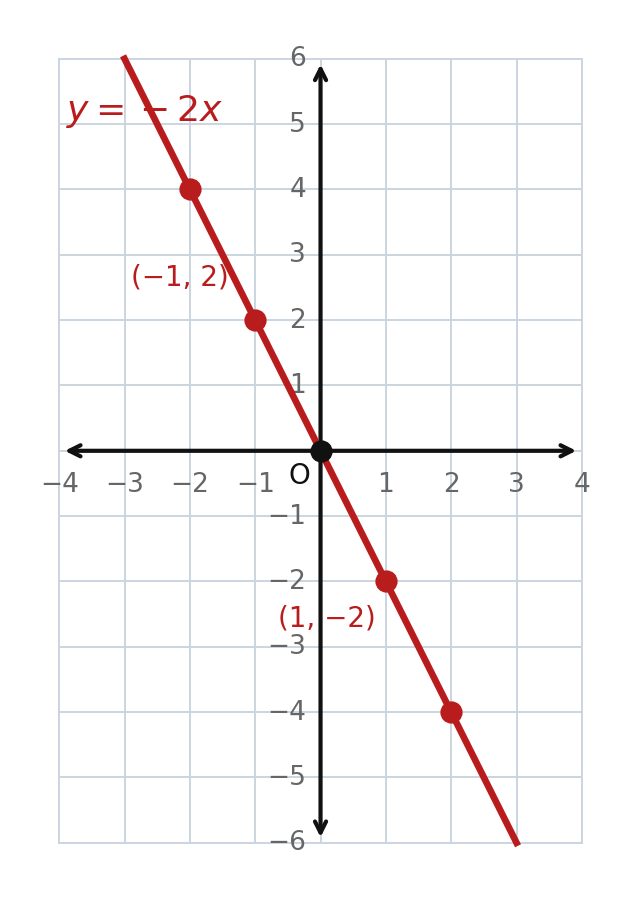
For , the slope is : from the origin move right 1 and down 2, landing on . Moving left 1 and up 2 lands on . Both are on the line, and the line falls from left to right, as a negative slope must.
Graphing from one point and the slope
Sometimes you are given a point on the line and the slope, and the point is not the origin.
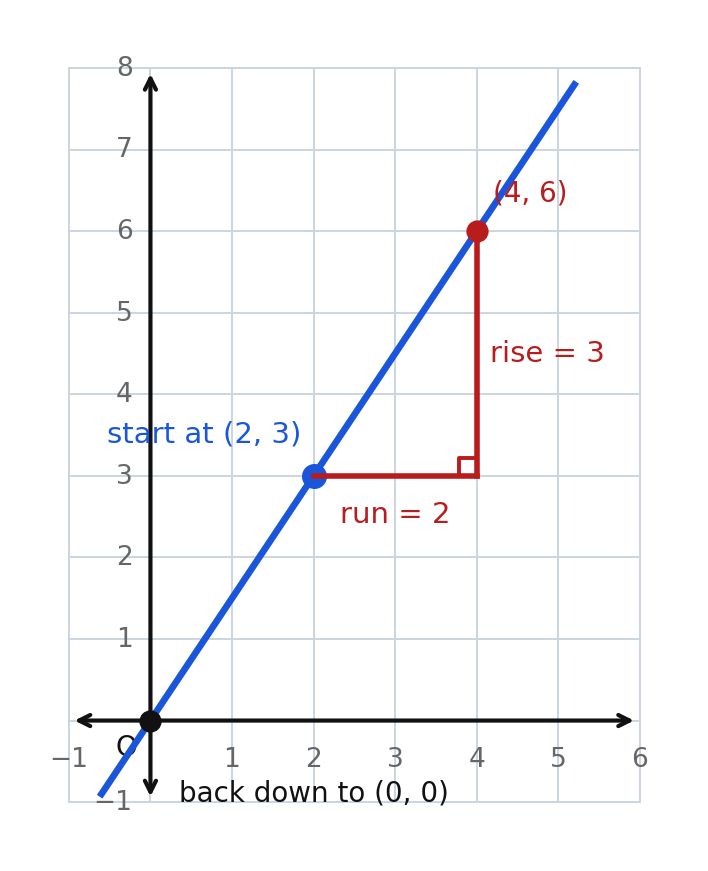
- Plot the given point — here, .
- Apply the slope as rise over run. With , move right 2 and up 3 to reach .
- Apply the slope backwards too. Move left 2 and down 3 from to reach .
- Draw the line.
Step 3 does double duty: it gives a third point and it confirms the relationship is proportional, because the line lands on the origin exactly.
Choosing points you can actually plot
When is a fraction such as , do not try to plot ; you would need , and eyeballing four tenths of a grid square invites error. Instead choose -values equal to the denominator or its multiples. For , take to get , and to get . Both land on grid intersections.
Graphs that come from a context
A contextual graph carries two extra responsibilities.
Label the axes with the quantity and its unit, such as "hours" and "dollars." Unlabeled axes turn a graph into a decoration.
Use only the part that makes sense. Negative hours and negative cookies do not exist, so a contextual proportional graph lives in the first quadrant, starting at the origin and climbing to the right.
Worked examples
Example 1 — Graphing
Plot . Slope : right 1, up 2 gives . Again: right 1, up 2 gives .
Answer: A line through , , and , rising to the right.
Example 2 — Graphing
Plot . Slope : right 1, down 3 gives . Again gives .
Answer: A line through , , and , falling to the right.
Example 3 — Graphing from a point and a slope
Graph the proportional line through with slope .
From , right 2 and up 3 gives . From , left 2 and down 3 gives .
Answer: A line through , , and . Its equation is .
Example 4 — A fractional slope
Graph .
Choose -values that are multiples of 4. gives ; gives .
Answer: A line through , , and .
Example 5 — A contextual graph
Kai babysits for $8 per hour. Graph the relationship between hours and earnings.
The equation is , with in hours and in dollars. Points: and .
Answer: A line through , , and , drawn only in the first quadrant, with the horizontal axis labeled "hours" and the vertical axis labeled "dollars."
Guided practice
- Graph . Name two points on the line other than the origin.
- Graph . Name two points on the line other than the origin.
- Graph the proportional line through the origin with slope . Name two points with whole-number coordinates.
- A proportional line passes through and has slope 2. Graph it, and state whether it passes through the origin.
- Graph . Name two points with whole-number coordinates other than the origin.
Independent practice
- Graph each line and name two points other than the origin. a) b) c)
- A proportional line passes through . Find its slope, write its equation, and name one more point on it.
- A proportional line passes through with slope . Verify that the point fits the slope, then name one more point on the line.
- Graph and use it to find when .
- A line through the origin has slope 0. Describe its graph and name a point on it other than the origin.
- Application. A bakery sells cookies for $1.50 each. Write the equation, name the points for 2 cookies and 6 cookies, and explain why only the first-quadrant part of the graph is used.
- Reasoning. Explain why knowing a relationship is proportional plus knowing one point other than the origin is enough to graph the entire line.
Exit ticket 7.5
- Graph . Name two points other than the origin.
- Graph the proportional line through the origin with slope . Name two points other than the origin.
- A proportional line passes through . Find its slope and write its equation.
- Explain how the origin gives you a free second point whenever you graph .
Lesson 7.6 — Connecting All Four Representations
One relationship, four pictures of it
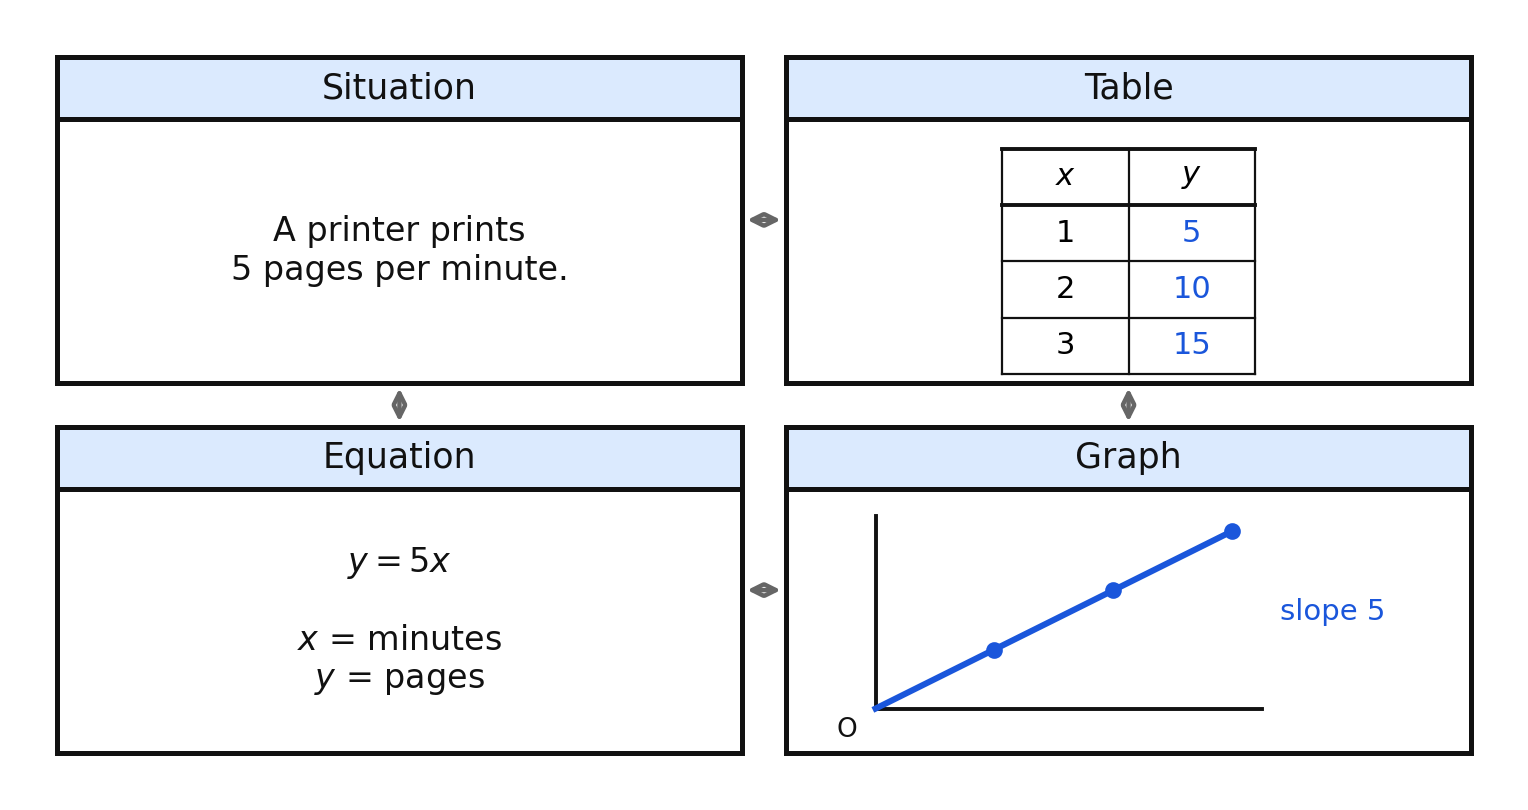
A proportional relationship can be shown in four ways, and they all carry the same information.
| Representation | What it looks like | Where the slope hides |
|---|---|---|
| Situation | a sentence describing a steady rate | the unit rate stated in words |
| Table | paired values of and | the quotient , equal in every row |
| Equation | the coefficient of | |
| Graph | a line through the origin | the rise over the run |
Each representation is best at a different job. A situation explains what the quantities mean. A table shows specific pairs at a glance. An equation makes prediction instant, even for values far outside the table. A graph shows the trend and lets you compare two relationships by steepness.
Moving from one to another
Situation to equation. Find the unit rate; that is . Define and with units.
Equation to table. Choose convenient -values and multiply each by .
Table to graph. Plot each row as an ordered pair, add the origin, and connect them.
Graph to equation. Read one grid-intersection point other than the origin; then .
Graph to situation. Interpret a point: on a graph of hours against dollars, the point says "6 hours of work pays $90."
Reading a point in context
This is the skill that ties the chapter together. A point on a contextual graph is a complete sentence waiting to be said out loud. On a graph of gallons against miles for a car that gets 32 miles per gallon, the point means "5 gallons of gasoline carries the car 160 miles." Both coordinates need their units, and the sentence needs a verb.
Comparing two relationships
Because slope is a rate, comparing two relationships means comparing their slopes — even when they arrive in different forms. A pump described by moves 18 gallons per minute. A second pump that fills 95 gallons in 5 minutes moves gallons per minute. The second is faster, and on one grid its line would be steeper.
Worked examples
Example 1 — Situation to table to equation to graph
Mira walks at a steady 4 miles per hour. Show this relationship all four ways.
Unit rate: 4 miles per hour, so .
| Hours | 1 | 2 | 3 |
|---|---|---|---|
| Miles | 4 | 8 | 12 |
Answer: Equation , with in hours and in miles. The graph is a line through , , and , drawn in the first quadrant.
Example 2 — Graph to equation to table
A line passes through the origin and . Write the equation and build a table for .
, so .
| 1 | 2 | 3 | |
|---|---|---|---|
| 2 | 4 | 6 |
Answer: , with the table above.
Example 3 — Table to situation
A car's fuel use is recorded below, with in gallons and in miles.
| 2 | 5 | 8 | |
|---|---|---|---|
| 64 | 160 | 256 |
, , . Proportional, .
The equation is . For 12 gallons: .
Answer: The car travels 32 miles per gallon; ; 12 gallons carries it 384 miles.
Example 4 — Comparing across representations
Plan A charges by the equation dollars. Plan B is shown in the table below. Which plan costs less per unit?
| 2 | 4 | |
|---|---|---|
| 17 | 34 |
Plan B: and , so .
Compare: .
Answer: Plan B, at $8.50 per unit versus $9.00 per unit.
Example 5 — Choosing the right tool
For , which representation would you use to find when , and why?
A table would need 400 rows and a graph would need an enormous grid.
Answer: The equation. Substituting gives in one step.
Guided practice
- A printer prints 5 pages per minute. Write the equation, then make a table for .
- For , make a table for .
- A line passes through the origin and . Write its equation.
- A proportional table has : 3, 6, 9 and : 21, 42, 63. Find the slope, write the equation, and name one point on the graph other than the origin.
- For , name the ordered pair on the graph when .
Independent practice
- A car travels 28 miles on each gallon of gasoline. Write the equation, make a table for 2 and 4 gallons, and describe the graph.
- A line passes through the origin and . Write the equation and make a table for and .
- A proportional table has : 2, 5, 10 and : 3, 7.5, 15. Find the slope, write the equation, and find when .
- Three relationships are described below. Give the slope of each. a) b) a table with : 1, 2, 3 and : 2, 4, 6 c) a line through the origin and
- Application. A wind turbine produces 15 kilowatt-hours of electricity each hour it runs. Write the equation, make a table for 4, 8, and 12 hours, and explain in a sentence what the point means.
- Application. Rice costs $2.80 per kilogram. Write the equation, make a table for 2, 5, and 7.5 kilograms, and find the cost of 4.25 kilograms.
- Reasoning. One student describes a relationship with a table and another describes it with a graph. Explain how to check whether they are describing the same relationship.
Exit ticket 7.6
- For , make a table for .
- A line passes through the origin and . Find the slope and write the equation.
- A proportional table has : 3, 6 and : 4.5, 9. Find the slope and write the equation.
- Which representation would you choose to find when , and why?
Chapter 7 Review
Vocabulary. rate of change · constant rate of change · slope · rise · run · slope triangle · origin · proportional relationship · direct variation
Part A — Slope as rate of change and writing (7.PFA.1a)
- A line passes through the origin and . Find its slope.
- A proportional table has : 2, 4, 6 and : 11, 22, 33. Find the slope and write the equation.
- A machine fills 24 bottles per minute. Write the equation and find how many bottles it fills in 15 minutes.
- A proportional table has : 1, 2, 3 and : , , . Find the slope and write the equation.
- A line passes through the origin and . Write its equation.
- A cyclist rides at a steady 13 miles per hour. Write the equation and find the distance ridden in 3.5 hours.
Part B — Positive, negative, and zero slope (7.PFA.1b)
- Classify each slope as positive, negative, or zero. a) b) c) d) a line through the origin and
- Describe the graph of a line through the origin whose slope is zero, and name two points on it.
- A line rises as you read it from left to right. What is the sign of its slope?
- Which line is steeper, or ? Explain.
Part C — Graphing from a point and the slope (7.PFA.1c)
- Graph the proportional line through . State its slope and equation.
- Graph the proportional line through . State its slope and equation.
- Graph the proportional line through . State its slope and equation.
Part D — Graphing from an equation (7.PFA.1d)
- Graph and name two points other than the origin.
- Graph and name two points with whole-number coordinates other than the origin.
- Graph and name two points with whole-number coordinates other than the origin.
Part E — Mixed application and reasoning (7.PFA.1e)
- A landscaper spreads 35 square feet of mulch per minute. Write the equation, make a table for 4, 10, and 20 minutes, describe the graph, and explain what the point means.
- A proportional table has : 2, 3, 5 and : 9, 13.5, 22.5. Find the slope, write the equation, and find when .
- Explain why the table with : 1, 2, 3 and : 6, 11, 16 is not proportional and cannot be written in the form .
- Pump A is described by , where is minutes and is gallons. Pump B fills 95 gallons in 5 minutes. Which pump is faster, and how would you see that on a single graph?
- Explain why the graph of every proportional relationship passes through the origin. Use the equation in your explanation.
- On one grid, describe the graphs of , , and . Name the slope of each, describe its direction, and state the one thing all three graphs have in common.
Standards coverage check — Chapter 7
| Knowledge and Skill | Where it is taught | Where it is practiced |
|---|---|---|
| 7.PFA.1a — determine slope as rate of change from a table, graph, or contextual situation, and write (positive slope only in context) | 7.1, 7.2, 7.3 | Items 1–48; Review Part A, items 97–102 |
| 7.PFA.1b — identify and describe a positive, negative, or zero slope from a graph | 7.4 | Items 49–64; Review Part B, items 103–106 |
| 7.PFA.1c — graph a proportional relationship given an ordered pair on the line and the slope | 7.5 | Items 65–69, 71–72, 76–79; Review Part C, items 107–109 |
| 7.PFA.1d — graph a proportional relationship given the equation | 7.5 | Items 65–67, 69–70, 73–75, 77–78, 80; Review Part D, items 110–112 |
| 7.PFA.1e — make connections among contexts, tables, equations, and graphs | 7.6 | Items 81–96; Review Part E, items 113–118 |
Every contextual item in this chapter uses a positive slope, as the standard requires. Negative slopes appear only in abstract items — lines, tables, and equations with no situation attached.
Answer keys for every set in this chapter are in Appendix A.