Chapter 18 — Comparing Linear, Quadratic, and Exponential Functions
Standard: A.F.2 (h)
A.F.2 — verbatim. The student will investigate, analyze, and compare characteristics of functions, including quadratic, and exponential functions, and model quadratic and exponential relationships. Students will demonstrate the following Knowledge and Skills: h) Compare and contrast the key characteristics of linear functions (), quadratic functions (), and exponential functions () using tables and graphs.
By the end of this chapter you will be able to:
- Place the three parent functions , , and on the same window and read what the picture says about shape, intercepts, and end behavior (A.F.2h)
- Build a table for each family and name the growth pattern that identifies it: constant first differences, constant second differences, or a constant common ratio (A.F.2h)
- Contrast the three rates of change — constant additive, changing additive, and constant multiplicative — and connect each rate to both a table and a graph (A.F.2h)
- Decide which family fits a given table, graph, or context, and justify the choice with a characteristic that the other two families do not share (A.F.2h)
Lessons: 18.1 Three Families on One Window · 18.2 Growth Patterns in Tables · 18.3 Rates of Change Compared · 18.4 Choosing the Model That Fits
Why this chapter matters. Chapters 5 through 7 taught you everything about a line. Chapter 16 taught you the parabola. Chapter 17 taught you the exponential curve. This chapter asks the question those three chapters were preparing for: when you meet a new relationship, which family is it? The answer is not a guess. It is a comparison — of shapes on a graph, of patterns in a table, and of how the output changes when the input increases by one. A.F.2h names that comparison as its own skill, because choosing the wrong family is how a model that looks fine for three data points fails on the fourth.
Scope note. This chapter compares the three parent families using tables and graphs. It does not teach you to graph a new parabola from vertex form (Chapter 16), to write from a story (Chapter 17), or to fit a curve of best fit to scatterplot data (Chapter 19). Transformations and are out of scope here; the parents are enough. The exponential base is a natural number, matching A.F.2e and A.F.2h. Most examples use ; a few use so the pattern, not the number, is what you learn.
Conventions this chapter fixes.
- The three parent functions of this chapter are (linear), (quadratic), and with a natural number greater than (exponential). Comparisons are made against these parents unless an item names a different member of the family.
- A first difference is the change in output when the input increases by . A second difference is the change in consecutive first differences. A common ratio is the factor by which each output is multiplied to get the next, when inputs are equally spaced.
- An intercept is a point. End behavior is described in words or with arrows such as "as , ."
- Currency amounts are written in plain text (for example, $5), never inside a math delimiter.
- Item numbering runs straight through the chapter, from 1 in Lesson 18.1 to 108 at the end of the review. It does not restart at each lesson.
Lesson 18.1 — Three Families on One Window
Three curves, one grid
A.F.2h asks you to compare three specific parents: the line , the parabola , and the exponential . The fastest way to start is to put all three on the same window and look.
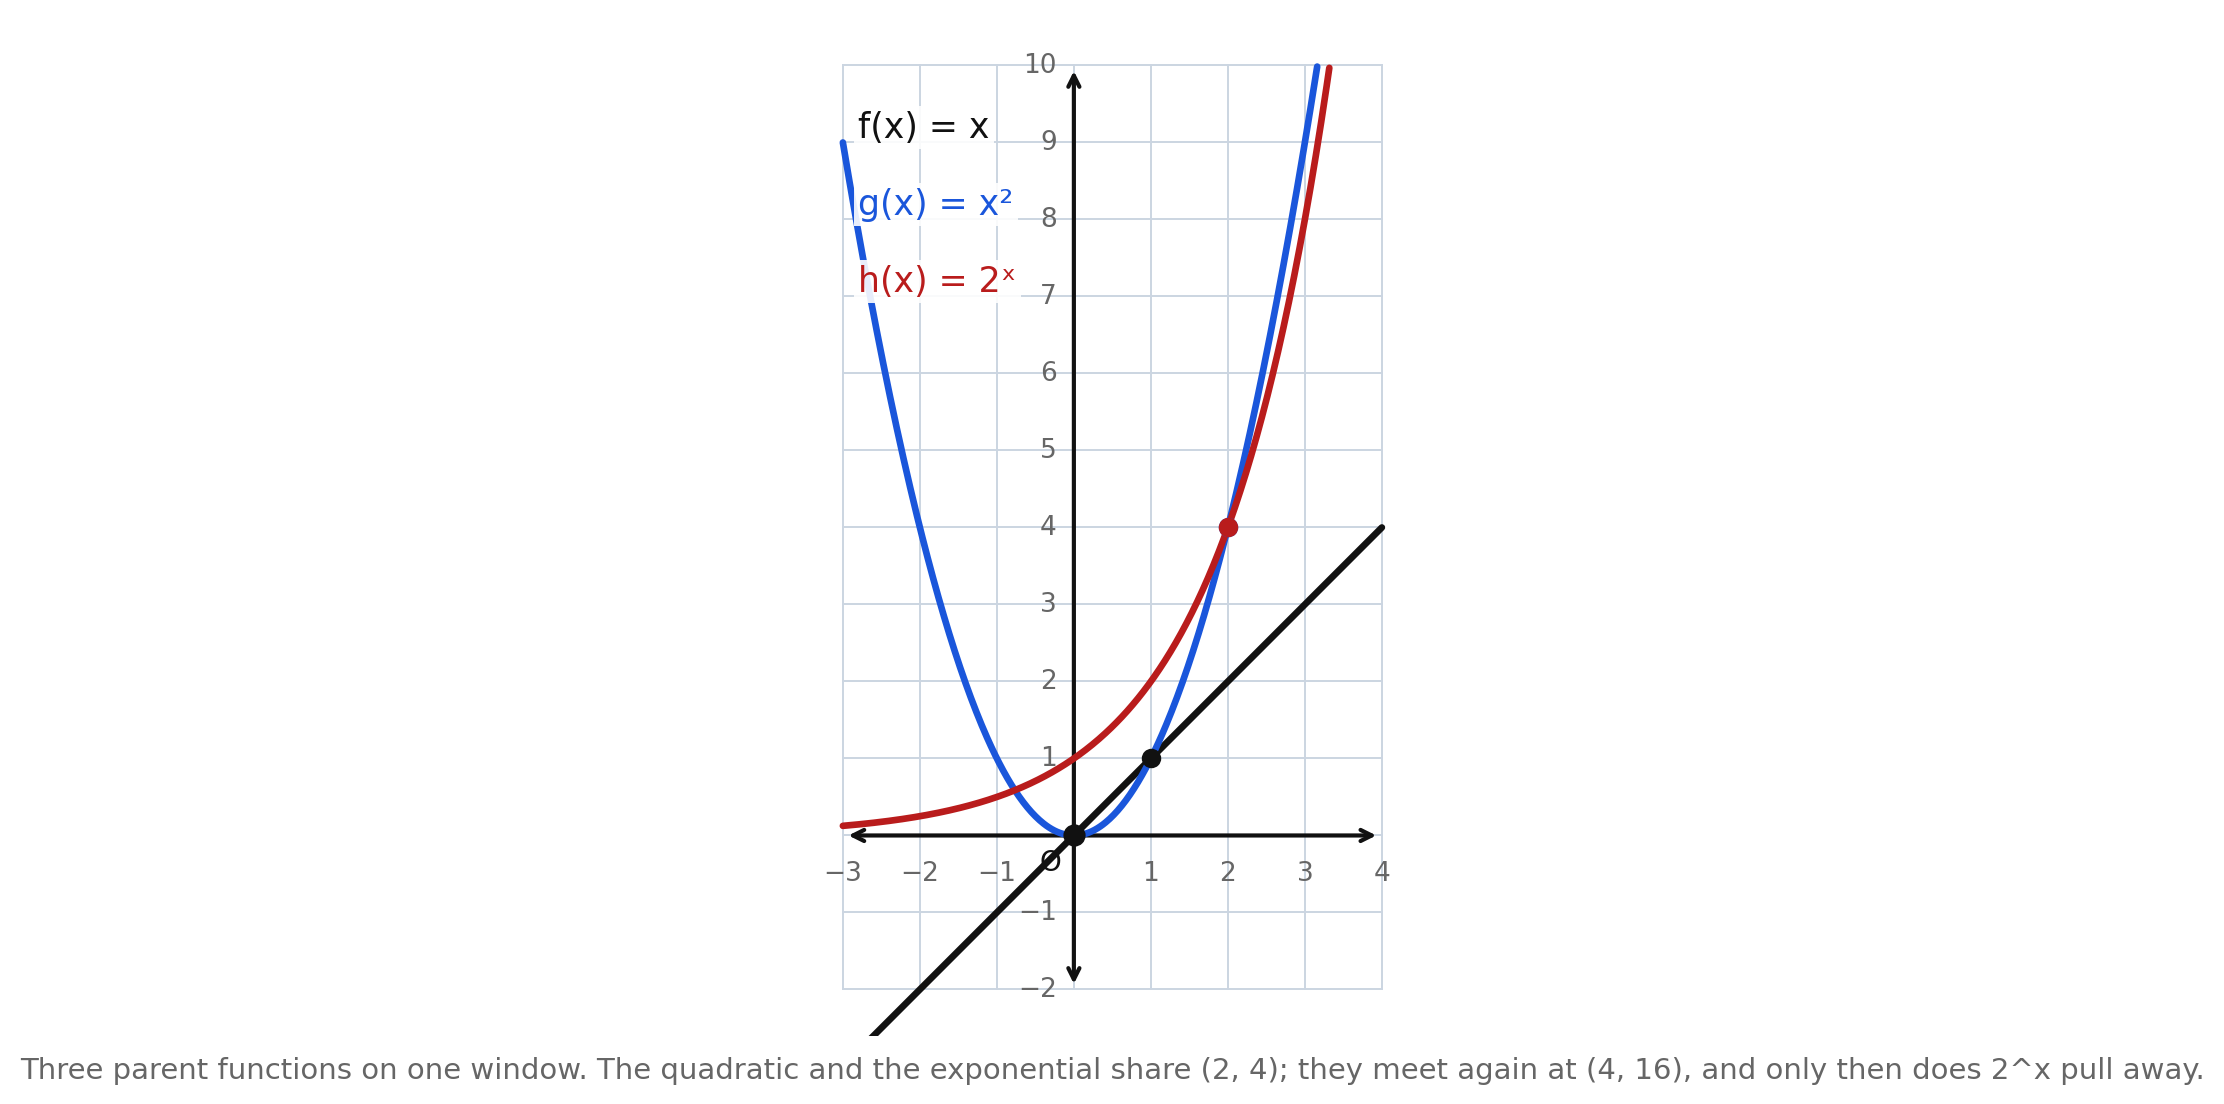
The figure uses , so . Three facts jump out before any calculation:
- Shapes disagree. One graph is a straight line, one is a U-shaped parabola, and one is a curve that stays above the -axis and steepens as grows.
- They meet, then separate. At the line and the parabola share the origin. At those two share while the exponential sits at . At the parabola and the exponential share . They meet again at , and after that pulls away — a fact Lesson 18.3 returns to on a taller window.
- The left half of the window is just as informative as the right. As goes negative, the line falls, the parabola rises, and settles toward without ever reaching it.
Those three observations — shape, meetings, and left-versus-right behavior — are the raw material of every comparison in this chapter.
Intercepts, family by family
Put each parent alone on the same window and the intercepts become readable.
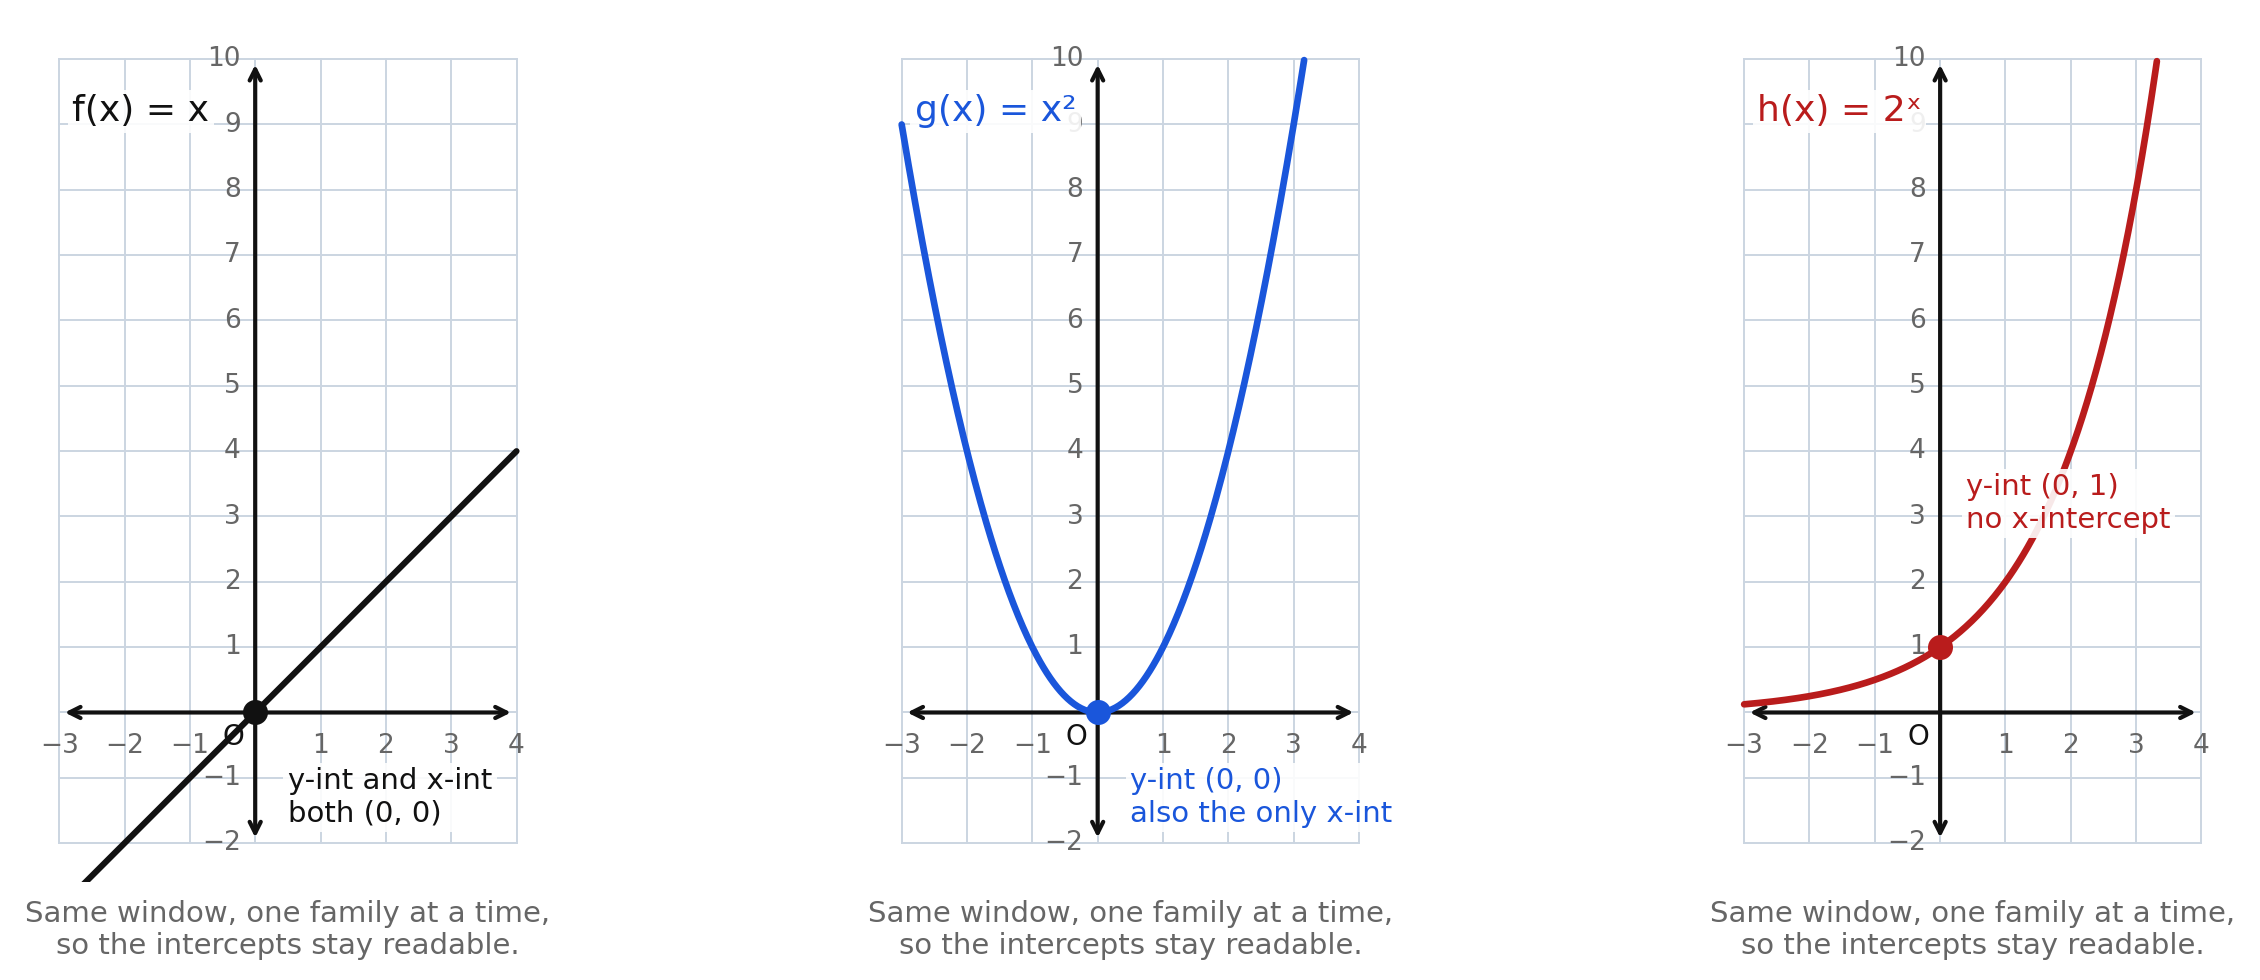
| Parent | -intercept | -intercept(s) |
|---|---|---|
| only | ||
| none |
Two parents cross the origin; the exponential does not. Two parents have an -intercept; the exponential never meets the -axis, because is always positive for a natural-number base . That single missing intercept is already a comparison A.F.2h cares about.
End behavior on the shared window
End behavior asks what the outputs do as the inputs run forever in either direction.
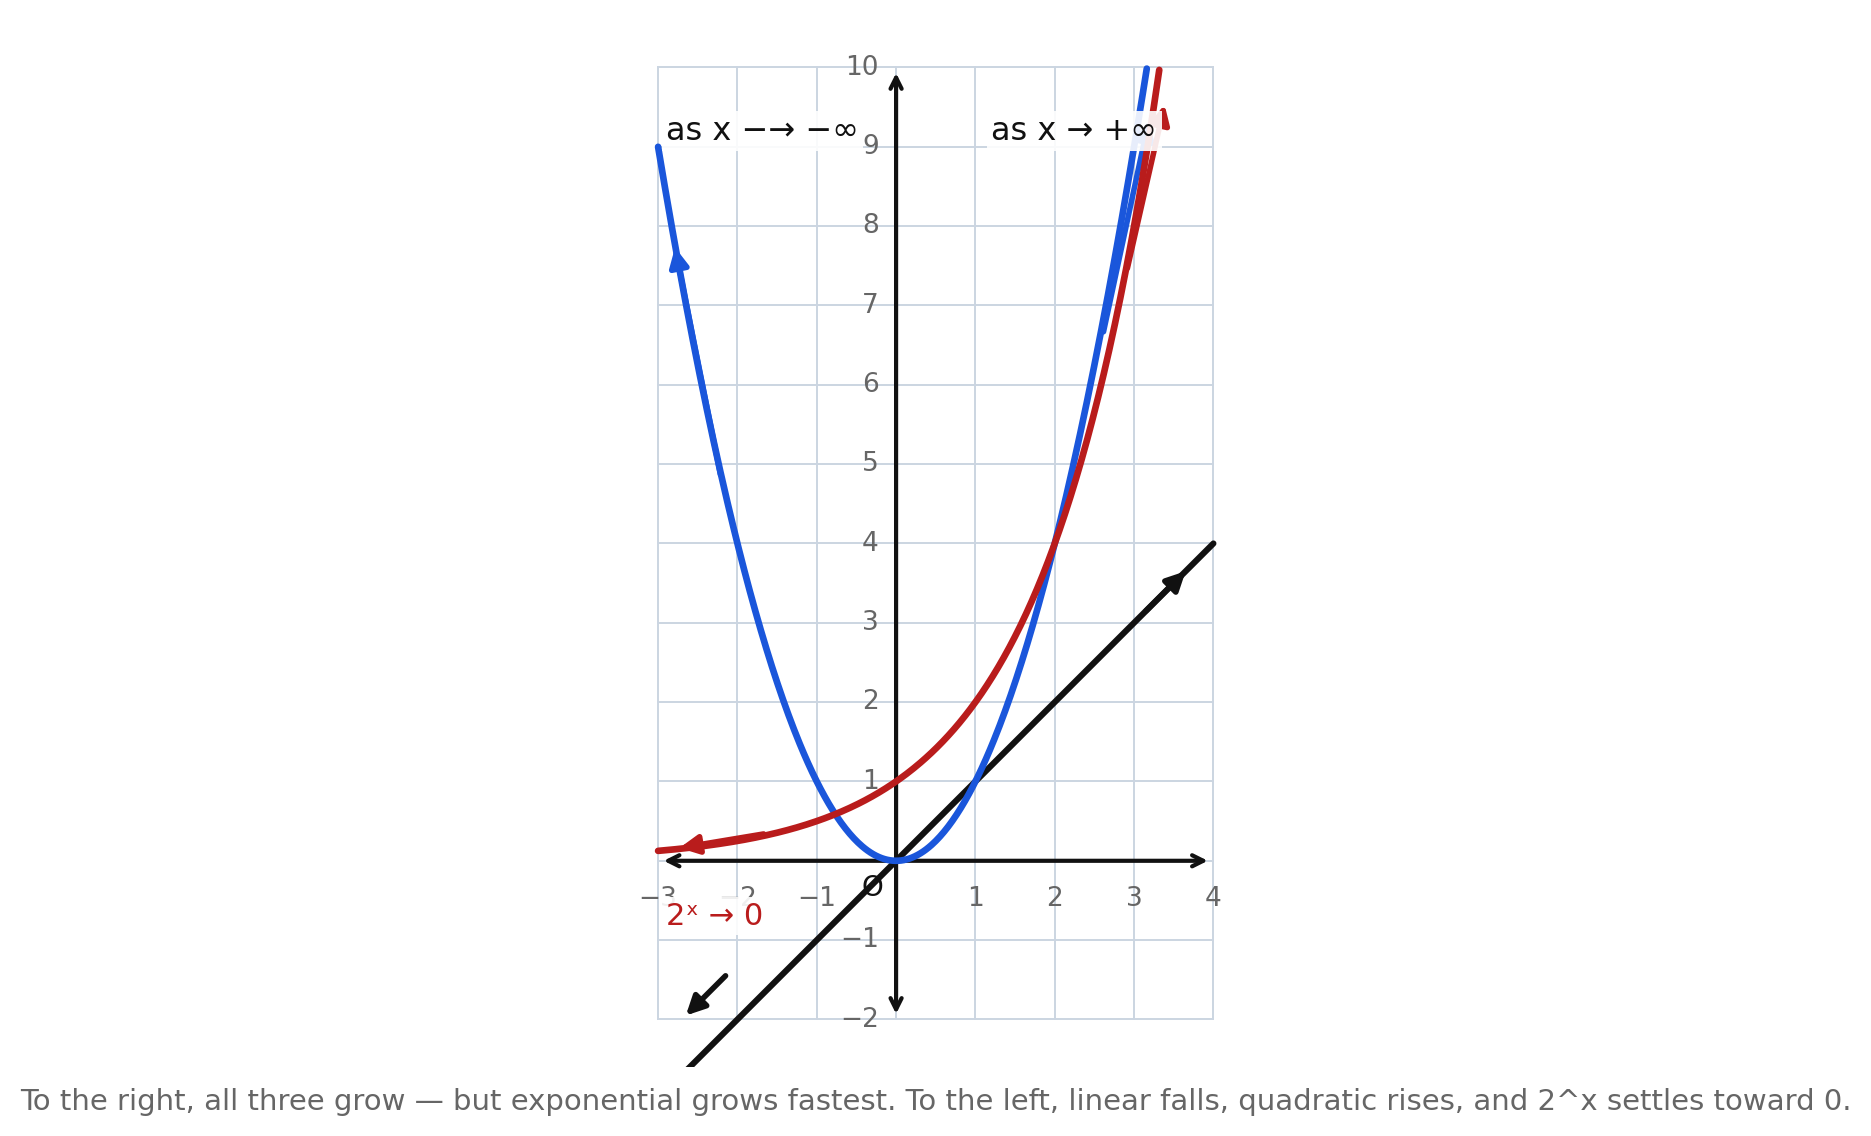
Reading the arrows:
- As : all three outputs go to . The exponential climbs fastest in the long run, the quadratic next, and the line slowest — but on a short window that order can look temporarily reversed, which is why Lesson 18.3 zooms out.
- As : the three disagree completely. The line falls to , the parabola rises to , and approaches from above.
So "they all grow on the right" is true but incomplete. The left side of the window is where the families tell themselves apart most clearly.
Domain and range, compared
All three parents accept every real input, so each domain is all real numbers. The ranges disagree:
- : range is all real numbers (the line reaches every height).
- : range is (the parabola never goes below the -axis).
- : range is (the curve never reaches and never goes negative).
A range that includes , a range that starts at , and a range that never reaches — three different answers to the same question, read straight off the graphs above.
Worked examples
Example 1 — Reading the shared window
On the three-families figure, which two parents share the point ?
Answer: and , because and .
Example 2 — An intercept that only one family has
Which of the three parents has -intercept ? Explain why the other two do not.
Answer: , because . Both and give at , so their -intercept is .
Example 3 — End behavior on the left
As , what happens to each of , , and ?
Answer: ; ; .
Example 4 — Range contrast
Can any of the three parents produce the output ? Which ones?
Answer: Only , at the input . The parabola and the exponential never produce a negative output.
Example 5 — A different base
Compare the -intercepts of and .
Answer: Both are , because any positive base to the power equals . The base changes the steepness, not the -intercept of .
Guided practice
- Use the three-families figure. Name the three parent equations shown, and say which curve is which by shape.
- On that same figure, name one point that lies on both and , and one point that lies on both and .
- Use the intercepts figure. Give the -intercept of each parent.
- On that same figure, which parent has no -intercept? Explain why can never equal .
- Use the end-behavior figure. As , what happens to all three outputs? Which grows fastest in the long run?
- As , describe what happens to each of , , and .
Independent practice
- Complete the comparison. a) Shape of : _______________ b) Shape of : _______________ c) Shape of : _______________
- Give the domain of each parent, and explain why the three domains agree.
- Give the range of each parent.
- Evaluate each parent at , , and . Organize the nine outputs in a small table.
- Application. A student sketches , , and on one grid but draws crossing the -axis somewhere left of the origin. What characteristic of exponential parents did the sketch violate?
- Reasoning. Explain why is on both and but not on .
- For , give the -intercept and say whether the graph has an -intercept.
- On the shared window, which parent is above the others at ? Which is below the -axis there?
- Error analysis. A student says "all three parents have range all real numbers, because the domain is all real numbers." Identify the error and give the three correct ranges.
- Compare and at . Which is larger, and by how much?
- Application. A lighthouse beam's height above the water is modeled by a function that is never negative and is at exactly one input. Which of the three parents matches those two facts? Justify.
- Sketch, from memory, the three parents on one pair of axes and mark , , and .
Exit ticket 18.1
- Name the -intercept of , of , and of .
- As , which parent approaches ?
- Give one characteristic that and share, and one characteristic that separates them.
- Why does A.F.2h insist on comparing the three families with both tables and graphs, not graphs alone?
Lesson 18.2 — Growth Patterns in Tables
First differences tell linear apart
A table hides the shape of a graph, but it advertises how the outputs change. When the inputs increase by each time, the change in consecutive outputs is the first difference, written .
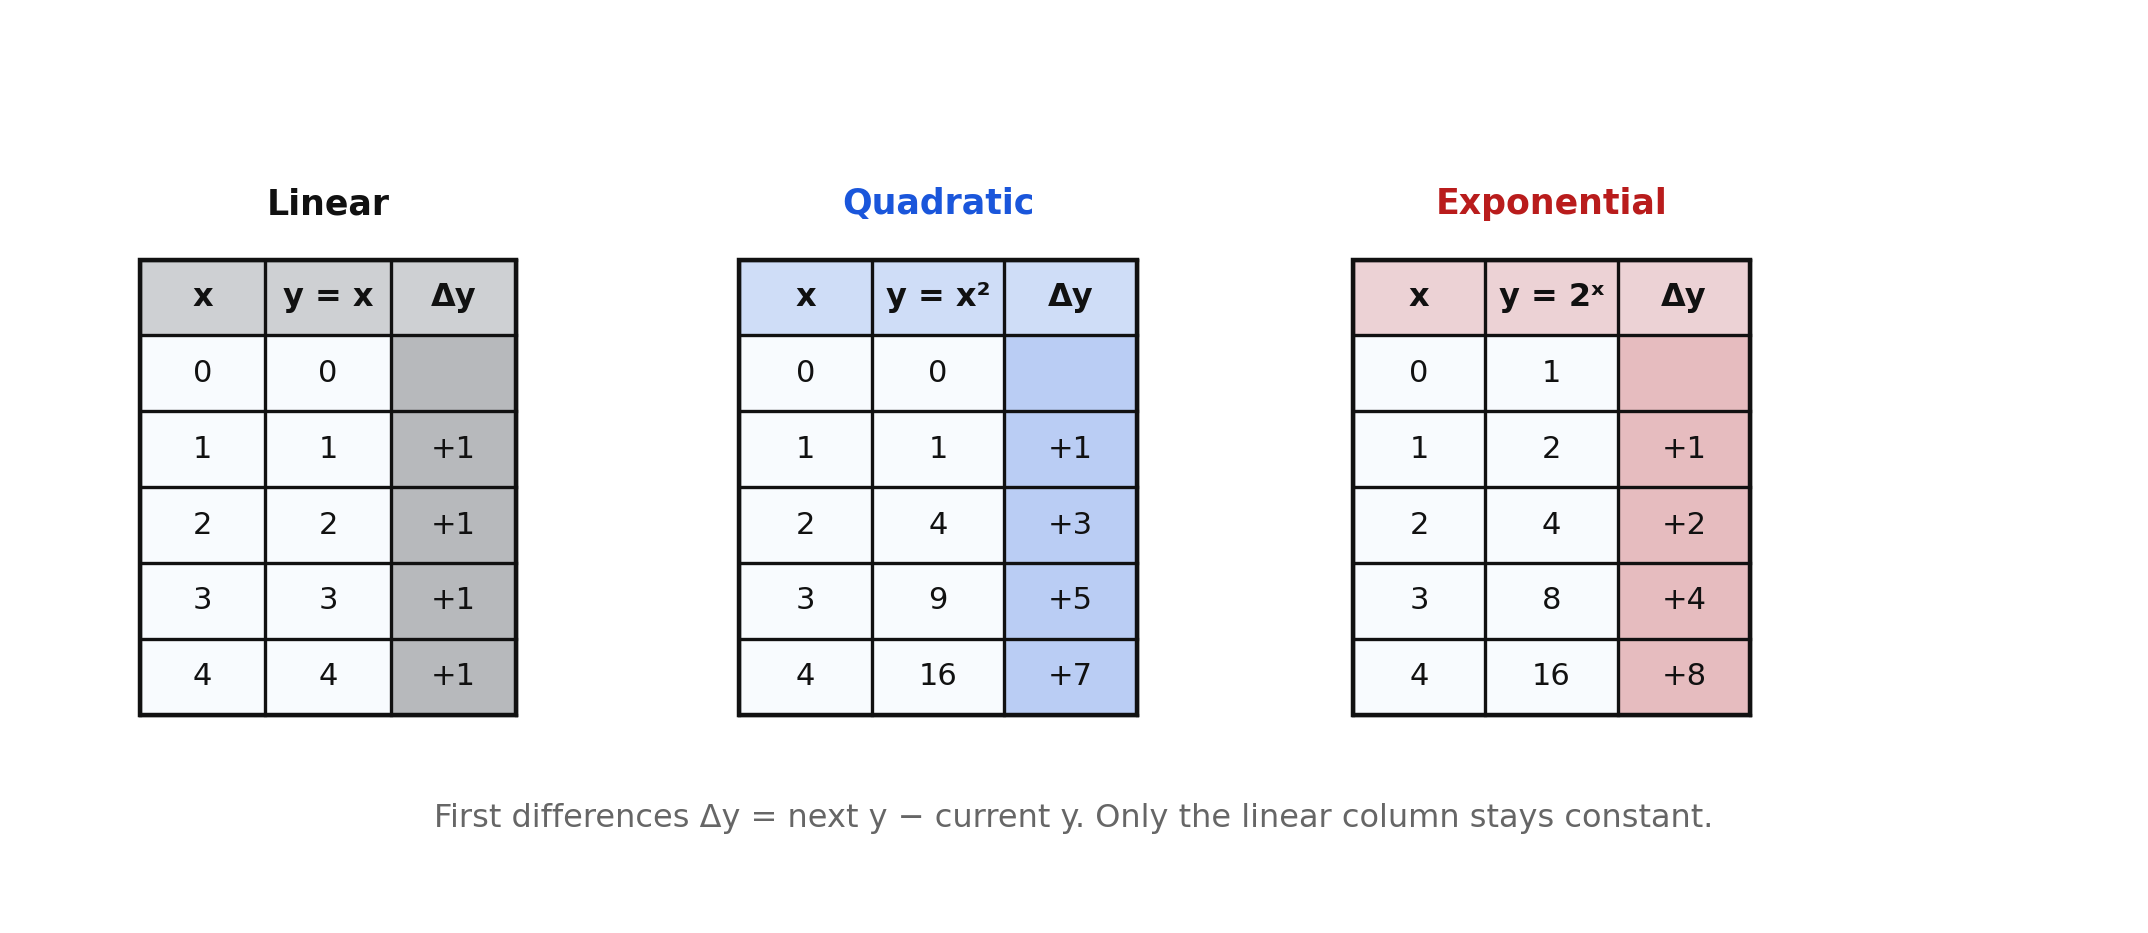
Read the highlighted columns:
- Linear : first differences are all . Constant first differences are the fingerprint of a linear relationship when -steps are equal.
- Quadratic : first differences are , , , . They grow, so the relationship is not linear.
- Exponential : first differences are , , , . They also grow — in fact they double — so first differences alone do not separate quadratic from exponential.
The rule to carry forward: constant first differences name a linear table. Non-constant first differences mean you need a second test.
Second differences and common ratios
When first differences change, ask two more questions.
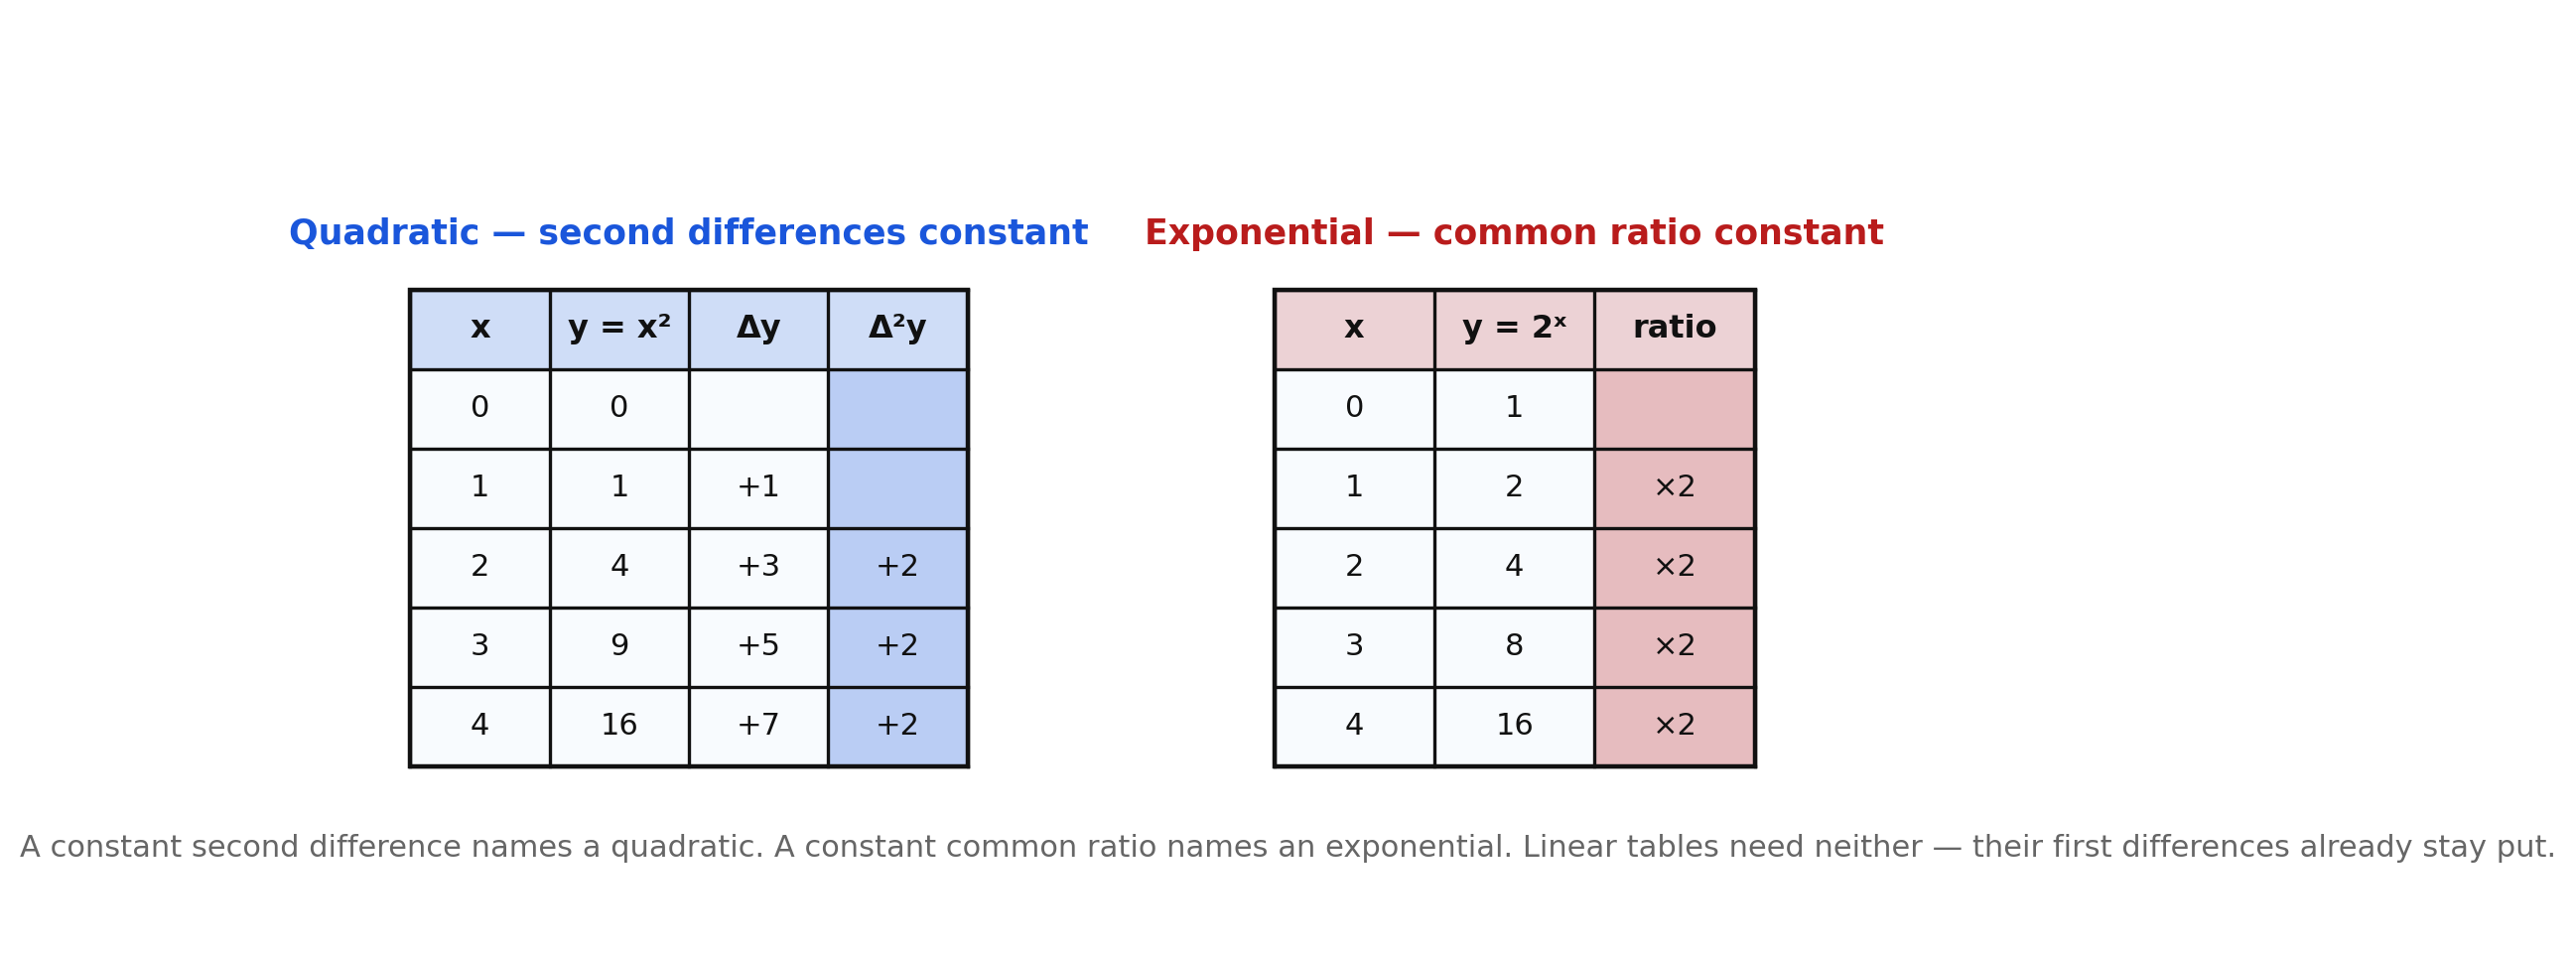
- Second differences are the changes in consecutive first differences. For they are all . A constant second difference names a quadratic table.
- Common ratios are successive outputs divided by previous outputs (with equal -steps). For every ratio is . A constant common ratio names an exponential table.
So the three tests line up with the three families:
| Family | Table fingerprint |
|---|---|
| Linear | first differences constant |
| Quadratic | second differences constant (first differences not constant) |
| Exponential | common ratio constant |
A linear table does not need second differences or ratios — its first differences already settle the question. Checking ratios on a linear table is not wrong, but the ratios will not be constant (except in special cases), and the first-difference test is the one that matches the definition of constant rate of change.
Building the tables yourself
The figures used . The same tests work for any equally spaced inputs. If a table arrives with -steps of , first differences still detect linearity, but the constant value is twice the slope; common ratios still detect exponential growth with the same base.
Worked examples
Example 1 — Naming the family from first differences
A table of against gives outputs , , , . Which family?
First differences: , , .
Answer: Linear — constant first differences.
Example 2 — Needing second differences
Outputs , , , , for through . Which family?
First differences: , , , (not constant). Second differences: , , (constant).
Answer: Quadratic.
Example 3 — Reading a common ratio
Outputs , , , for equally spaced inputs. Which family?
Ratios: , , .
Answer: Exponential with common ratio .
Example 4 — A table that is not any of the three
Outputs , , , , for through . What do the tests say?
First differences: , , , (not constant). Second differences: , , (not constant). Ratios: , , about , (not constant).
Answer: None of the three parent families. The tests correctly refuse to force a match.
Example 5 — Same pattern, different numbers
The table for at is , , , . Name the fingerprint.
Answer: Common ratio — exponential with base .
Guided practice
- Use the first-differences figure. Copy the three columns and say which one is constant.
- On that same figure, why is "first differences grow" not enough to decide between quadratic and exponential?
- Use the second-differences-and-ratios figure. What constant second difference does show?
- On that same figure, what common ratio does show?
- Complete a table for at , and compute .
- Complete a table for at those same inputs, and compute both and .
Independent practice
- Complete a table for at through , and compute the common ratios.
- Identify the family of each table (equal -steps assumed). a) outputs , , , , b) outputs , , , , c) outputs , , , ,
- For the table in 30b, show the first and second differences.
- For the table in 30c, show the common ratios.
- Application. A plant's height in centimeters after , , , weeks is , , , . Which family fits, and what does the constant first difference mean in context?
- Application. A rumor reaches , , , people on four consecutive days. Which family fits, and what is the common ratio?
- Build a five-row table for starting at . Confirm the common ratio is .
- Error analysis. A student looks at outputs , , , and says "first differences are , , , which grow by doubling, so it is quadratic." Identify the error and give the correct family.
- Reasoning. Explain why a linear table with slope has first differences equal to when increases by .
- A table has constant second differences of and non-constant first differences. Which family is it, and give one example of outputs that fit.
- Outputs , , , , with equal -steps. Is this exponential? If so, what is the common ratio?
- Application. Ticket sales rise by exactly $12 each hour for five hours. Which family's table fingerprint matches, and why do you not need second differences?
Exit ticket 18.2
- State the table fingerprint of each family in one short phrase.
- Outputs , , , . Family?
- Outputs , , , . Show that second differences are constant, and name the family.
- Outputs , , , . Family and common ratio?
Lesson 18.3 — Rates of Change Compared
Three meanings of "how fast"
A rate of change answers "what happens to when increases by one?" The three families give three different answers.
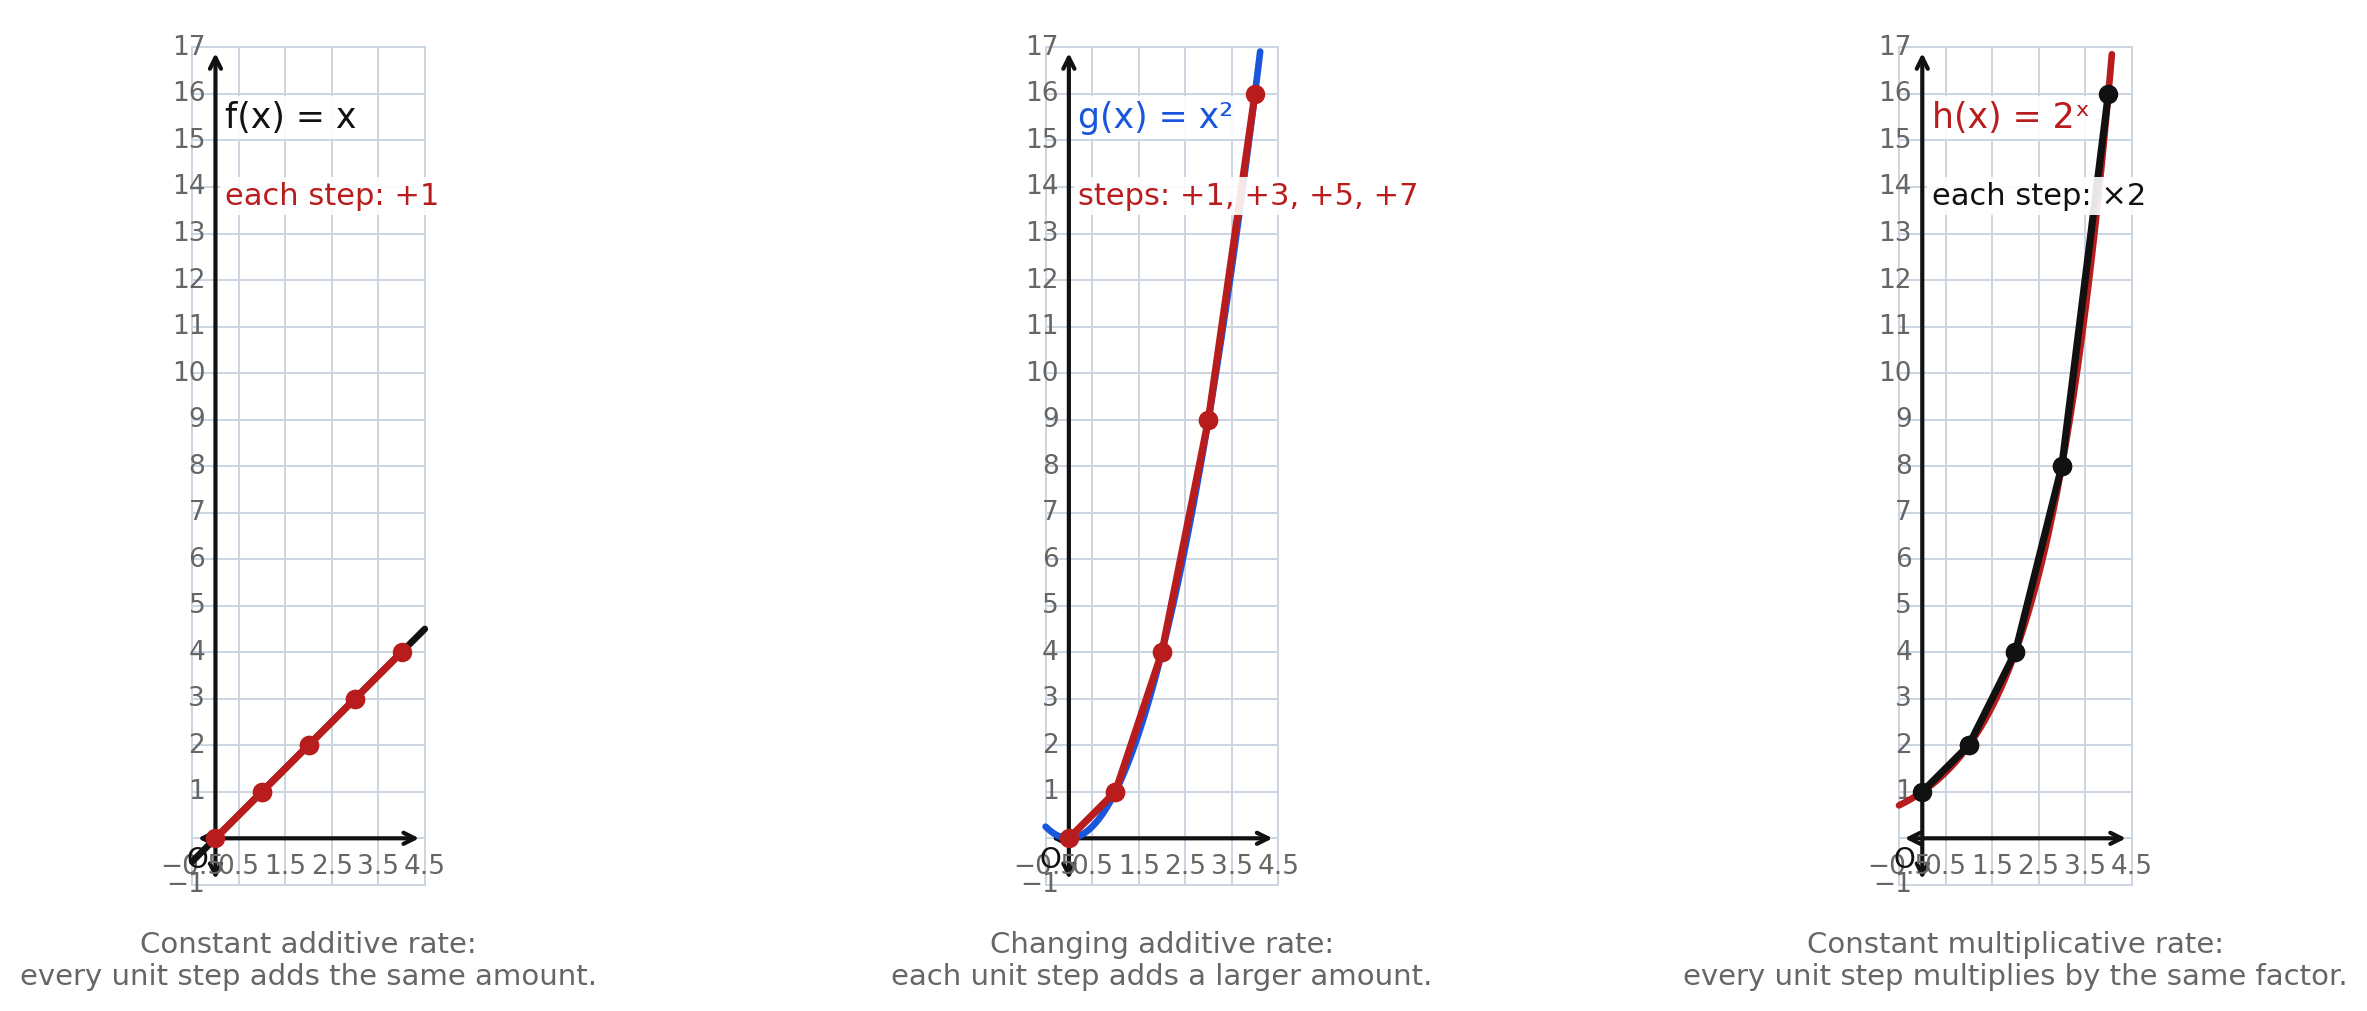
- Linear : each unit step adds . The additive rate is constant. That is exactly what slope means, and exactly what constant first differences recorded in Lesson 18.2.
- Quadratic : each unit step adds , then , then , then . The additive rate changes — it grows by each time, which is the constant second difference.
- Exponential : each unit step multiplies by . The additive jumps get bigger (, , , ), but the multiplicative rate stays put.
So "rate of change" is not one idea. For a line it is an additive constant. For a parabola it is an additive amount that itself changes steadily. For an exponential it is a multiplicative constant.
The long-run race
On a short window, can sit above for a stretch. Zoom out and the story changes.
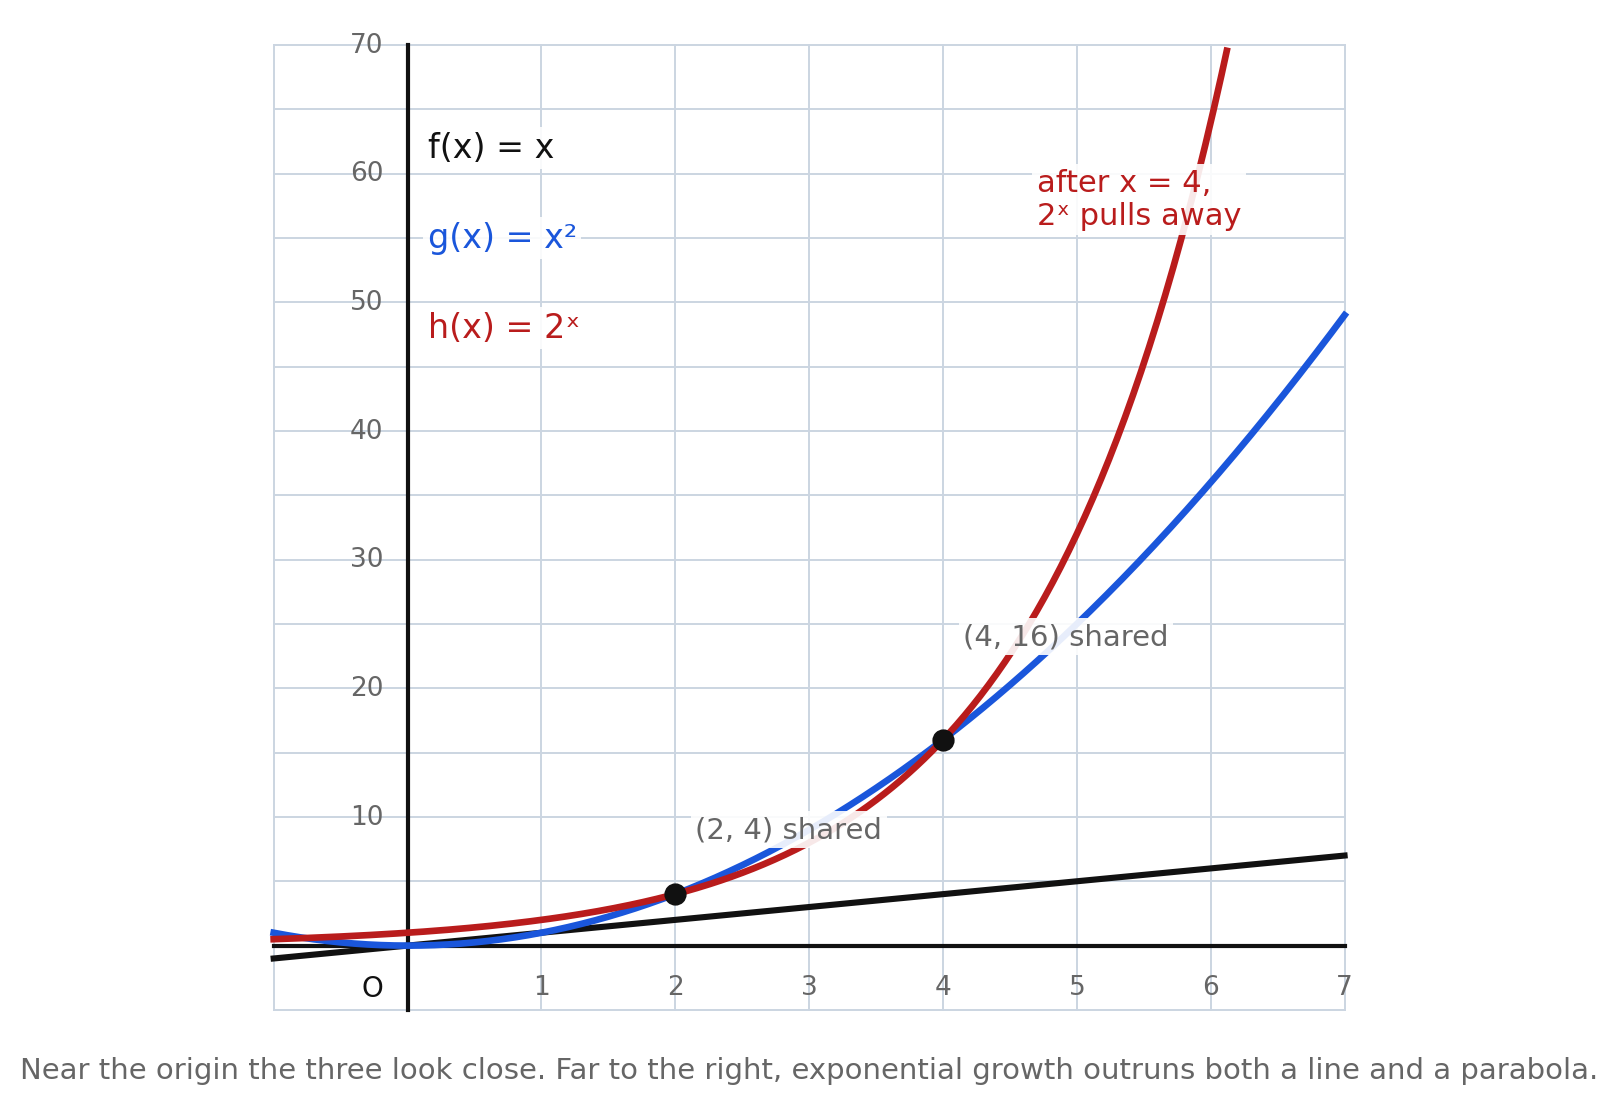
The figure marks two shared points: and . Between them the parabola is slightly higher. After , climbs past and never looks back — at the exponential is already at while the parabola is at , and the line is still at .
End behavior as therefore ranks the three families by long-run growth: exponential fastest, quadratic next, linear slowest. That ranking is a key characteristic A.F.2h expects you to contrast, and it is invisible if you only ever look near the origin.
Connecting rate language to graph language
| Family | Table says | Graph says |
|---|---|---|
| Linear | constant | chords of equal rise; straight line |
| Quadratic | constant | chords steepen; U shape |
| Exponential | common ratio constant | chords steepen faster; approaches a horizontal asymptote on the left for |
The same comparison, told twice — once in numbers, once in pictures.
Worked examples
Example 1 — Naming the rate
For , what is the change in when increases from to ?
Answer: . Every unit step adds .
Example 2 — A changing additive rate
For , find the rise from to and from to .
Answer: , then . The additive rate grew by .
Example 3 — A multiplicative rate
For , what happens to the output when increases by ?
Answer: It doubles — multiply by .
Example 4 — Reading the race
At , which parent is largest: , , or ?
Answer: , , and , so is largest.
Example 5 — Why the short window misleads
At , which is larger, or ? Does that contradict "exponential grows fastest"?
Answer: , so the parabola is larger there. It does not contradict the long-run claim, which is about , not about every individual input.
Guided practice
- Use the rate-of-change figure. For , what does each highlighted chord add?
- On that same figure, list the four step sizes shown for .
- On that same figure, what multiplicative factor labels every chord of ?
- Use the long-run figure. Name the two shared points marked on and .
- On that same figure, which parent is largest at ? Give the three outputs.
- Explain in one or two sentences why a short window can temporarily show above even though exponential growth wins in the long run.
Independent practice
- Fill in the rate description. a) Linear: constant _______________ rate b) Quadratic: _______________ additive rate c) Exponential: constant _______________ rate
- Compute the unit-step rises of from through . Confirm that the second differences are all .
- Compute successive ratios of for through .
- At , , , , and , decide whether or is larger (or equal).
- Application. A road crew paints meters of line every hour. Is the rate additive or multiplicative, and which family matches?
- Application. A bacteria count triples every hour. Is the rate additive or multiplicative, and which family matches?
- Reasoning. Why is it fair to say a quadratic has a "rate of change of its rate of change" that is constant?
- Sketch the three unit-step stories for , , and from to as three small tables of rises or ratios.
- Error analysis. A student says exponential growth is "the same as quadratic growth with bigger steps." Separate the two ideas using additive versus multiplicative language.
- On the long-run figure, estimate roughly where exceeds , and compare that input to where would reach .
- Compare end behavior as for the three parents in one ranked sentence.
- Compare end behavior as for the three parents in one sentence each.
Exit ticket 18.3
- Give one sentence that contrasts the rate of change of with the rate of change of .
- At , show that and agree, and state what happens after that input.
- What does a constant second difference say about the additive rate of a quadratic?
- Why does A.F.2h want both tables and graphs when comparing rates of change?
Lesson 18.4 — Choosing the Model That Fits
A board of contrasting characteristics
By now the comparisons can sit on one board.
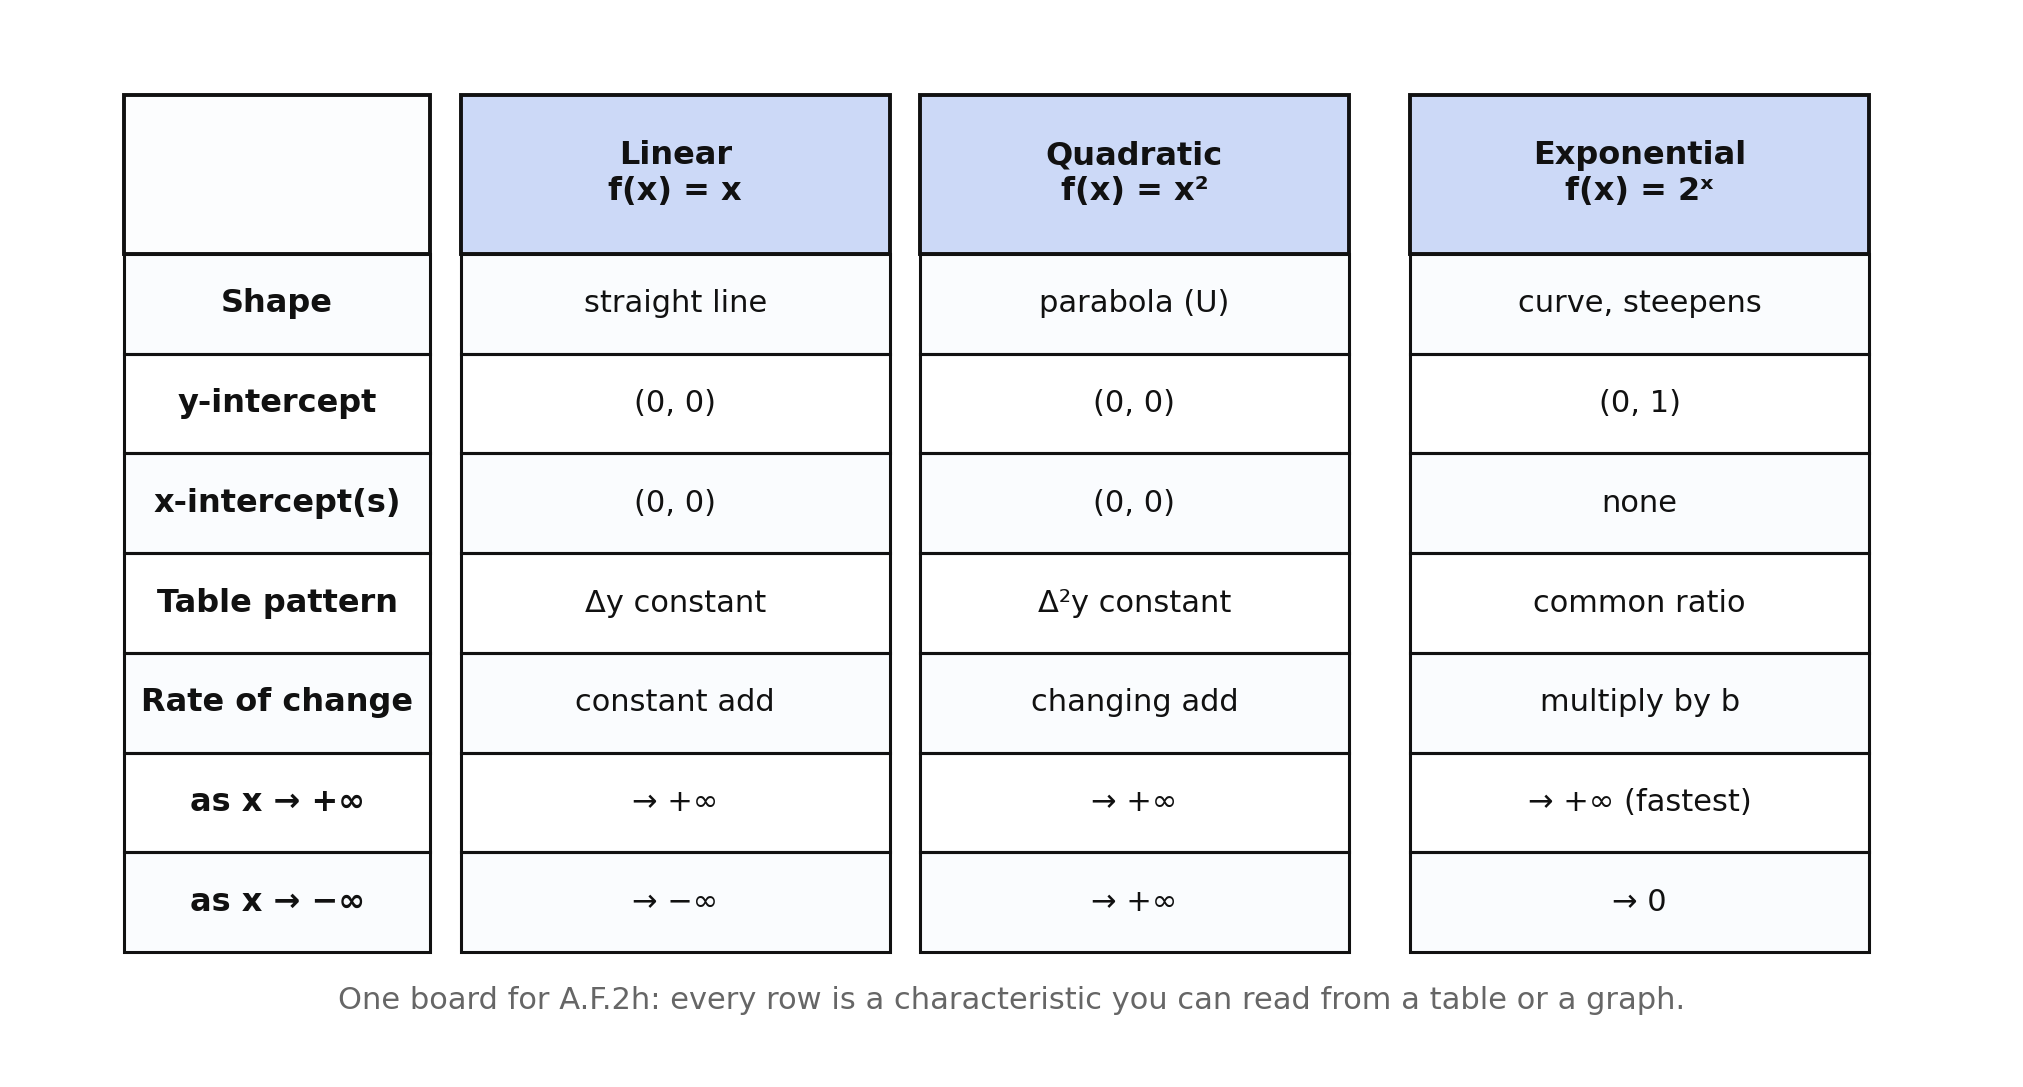
Every row is a characteristic you can read from a table or a graph. When a problem asks you to choose a family, pick the row that separates the options most cleanly — often the table fingerprint or the left-hand end behavior — and cite it.
Matching a context to a family
Contexts announce their family in the same language the tables use.
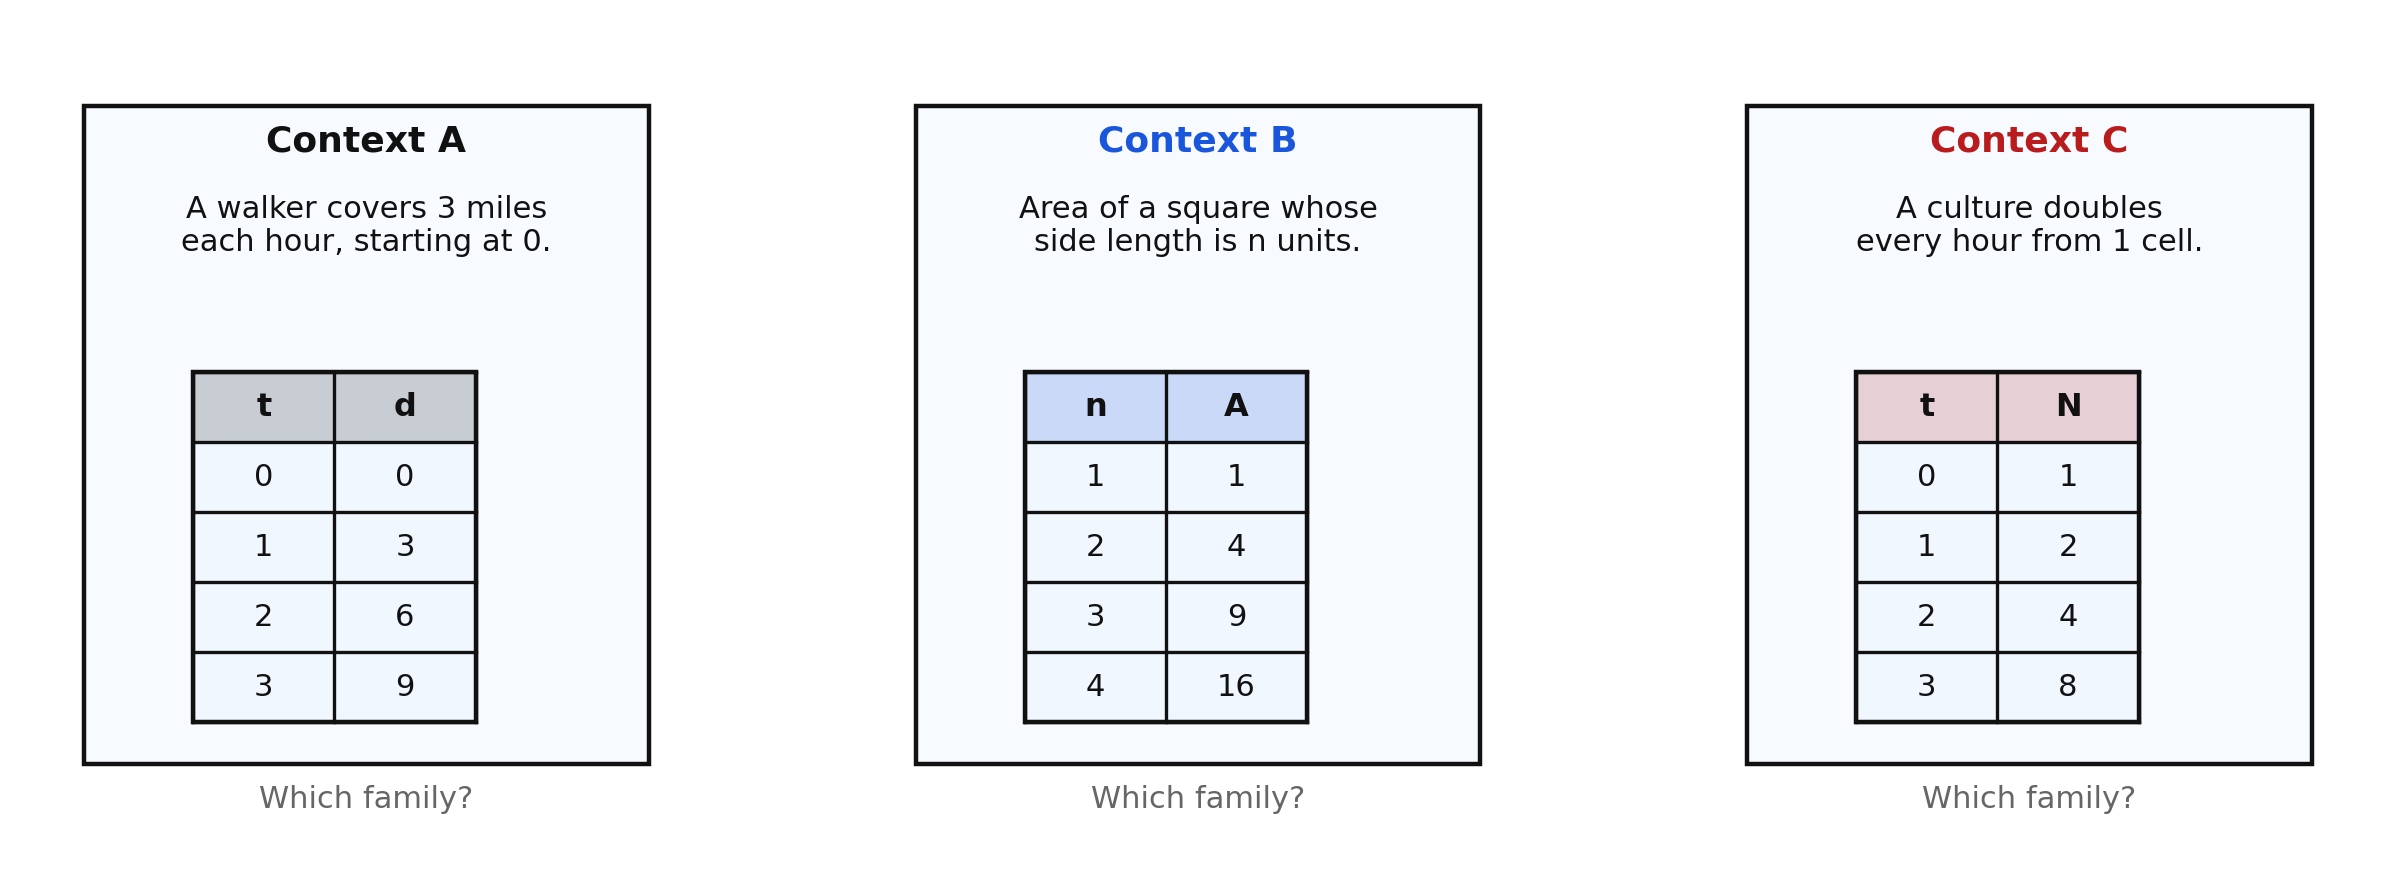
- Context A adds miles every hour: constant first differences → linear.
- Context B is area : constant second differences → quadratic.
- Context C doubles every hour: common ratio → exponential.
The story's verbs matter. "Adds the same amount each time" is linear. "Depends on a length times itself" is quadratic. "Multiplies by the same factor each time" is exponential.
A decision habit
When a table, graph, or context arrives, run this short checklist:
- Equal input steps? If yes, compute first differences.
- First differences constant? → linear.
- If not, compute second differences and ratios.
- Second differences constant? → quadratic. Ratios constant? → exponential.
- Confirm on the graph or in the story: shape, intercepts, and whether the rate is additive or multiplicative.
If none of the fingerprints fit, say so — forcing a family is worse than naming a mismatch.
Worked examples
Example 1 — Context A
Which family fits the walker who covers miles each hour from a start of ?
Answer: Linear. First differences in the table are all .
Example 2 — Context B
Which family fits the area of a square of side ?
Answer: Quadratic. The outputs are , , , , matching , with constant second difference .
Example 3 — Context C
Which family fits a culture that doubles every hour from cell?
Answer: Exponential. Common ratio , matching .
Example 4 — A graph clue
A graph passes through , never meets the -axis, and approaches the -axis on the left. Which parent is it?
Answer: for some natural number .
Example 5 — Rejecting a wrong fit
Outputs , , , with equal -steps. A student claims exponential because the outputs grow. Respond.
First differences: , , . Second differences: , . Ratios: , , — not constant.
Answer: Quadratic, not exponential. Growth alone is not a fingerprint; the constant second difference is.
Guided practice
- Use the comparison board. Give the table pattern row for all three families.
- Use the contexts figure. Identify the family for Context A and cite the fingerprint.
- Identify the family for Context B and cite the fingerprint.
- Identify the family for Context C and cite the fingerprint.
- Which row of the comparison board separates from on the left end of the -axis?
- Which row separates from at the -intercept?
Independent practice
- Match each description to a family. a) Constant additive rate b) Constant multiplicative rate c) Constant second differences
- A graph is a straight line through the origin. Which parent is it, and which two board rows confirm the match?
- A graph is a U with vertex at the origin. Which parent is it?
- A graph has -intercept and no -intercept. Which parent is it?
- Application. A savings account balance is $100, then $200, then $400, then $800 on equally spaced dates. Which family fits, and write a parent-style rule of the form or that matches the pattern of growth (common ratio).
- Application. The area of circular pizza trays with radius , , , inches grows like , , , times a constant. Which family is the growth pattern, and why?
- Outputs , , , . Which family, and what is special about the rate?
- Error analysis. A student matches Context C to "quadratic, because the numbers get bigger faster and faster." Identify the confusion and correct the match.
- Reasoning. Why is "gets bigger faster and faster" true of both quadratic and exponential tables, and what finer test separates them?
- Give a real-world sketch (one or two sentences) that should be modeled by each of the three families.
- Using the comparison board, name two characteristics that all three parents share as , and two characteristics that all three disagree on as .
- Application. A phone's remaining storage starts at GB and drops by GB every week. Which family fits the remaining-storage function, and what is the constant first difference?
Exit ticket 18.4
- Context: a side length and the area . Family?
- Context: a population that multiplies by each year. Family?
- Context: a car traveling at constant speed. Family?
- Name the single best table test for each family.
Chapter 18 Review
Vocabulary. linear parent · quadratic parent · exponential parent · first difference · second difference · common ratio · rate of change · end behavior · -intercept · -intercept · domain · range
A.F.2h is a single comparison bullet, so this review is organized by how the comparison is made: graphs, tables, rates, and model choice.
Part A — Graphs and characteristics
- On one pair of axes, the graphs of , , and are drawn. Give the -intercept of each.
- Which of those three graphs has no -intercept? Explain.
- Describe the end behavior of each parent as .
- Use the three-families figure. Name a point shared by and , and say what happens to those two curves after .
- Give the domain and range of each parent.
Part B — Tables and fingerprints
- State the table fingerprint of linear, quadratic, and exponential relationships.
- Identify the family: outputs , , , , with equal -steps.
- Identify the family: outputs , , , , . Show second differences.
- Identify the family: outputs , , , . Give the common ratio.
- Error analysis. Outputs , , , . A student says exponential because the first differences double at first. Respond with the full set of tests.
Part C — Rates and long-run growth
- Contrast the rate of change of with that of in one sentence each.
- At , which is larger, or ? At ?
- Use the long-run figure. Why do the shared points and matter for the comparison?
- Rank the three parents by growth as .
Part D — Choosing a model
- Match each context to a family and cite one fingerprint. a) Distance under constant speed b) Area of a square of side c) A culture that doubles hourly
- A graph approaches the -axis on the left, crosses the -axis at , and climbs steeply on the right. Which family?
- Application. Warehouse inventory is , , , crates at the end of four consecutive days. Which family fits, and interpret the first difference in context.
- Application. Side lengths through produce painted areas , , , square units on a poster. Which family, and why is "gets bigger faster" not a complete justification?
- Reasoning. Explain why A.F.2h names the specific parents , , and rather than "any line, any parabola, any exponential."
- Application. Choose a family for each: (i) a flat fee plus a constant charge per mile; (ii) the height of a ball under gravity as a function of time after launch, ignoring air (quadratic in time); (iii) a viral video's view count that multiplies by about each hour for several hours. Justify each choice in one phrase.
Standards coverage check — Chapter 18
A.F.2h is a single bullet that demands comparison across three families using both tables and graphs, so coverage is broken out by the characteristic being compared and by the representation used.
| Knowledge and Skill | Characteristic compared | Where it is taught | Where it is practiced (graphs) | Where it is practiced (tables) | Where it is applied in context |
|---|---|---|---|---|---|
| A.F.2h — compare and contrast key characteristics of , , and using tables and graphs | Shape / appearance | 18.1 (shared window); 18.4 (board) | 1, 7, 18, 74, 75, 76; 89, 104 | — | 17, 82 |
| A.F.2h | Intercepts | 18.1 (trio figure); 18.4 (board) | 3, 4, 12, 13, 19, 72; 89, 90 | — | 17 |
| A.F.2h | Domain and range | 18.1 | 8, 9, 15; 93 | — | 17 |
| A.F.2h | End behavior | 18.1 (arrows); 18.3 (long-run race) | 5, 6, 14, 20, 21, 61, 62; 91, 92, 102 | — | — |
| A.F.2h | Table fingerprints (, , ratio) | 18.2 | — | 23–32, 35–39, 41–44; 94–98 | 33, 34, 40, 105, 106 |
| A.F.2h | Rates of change (additive vs multiplicative) | 18.3 | 45–47, 58, 63; 99 | 51–53, 57, 65 | 55, 56, 84 |
| A.F.2h | Long-run growth ranking | 18.3 (race figure) | 48–50, 54, 60, 64; 100–102 | — | — |
| A.F.2h | Choosing a model | 18.4 (contexts + board) | 71, 72, 74–76, 104 | 67–70, 73, 79, 88; 103 | 68–70, 77, 78, 80–82, 84–87; 103, 105–108 |
Supporting items: 10, 16, and 54 ask for direct evaluation that feeds a comparison; 11, 15, 36, 59, 80, and 98 are error analyses aimed at the most common confusions (drawing across the -axis, treating domain as range, calling any accelerating table quadratic, and equating "gets bigger faster" with a single family). Item 22 and item 66 ask why both representations are required; item 107 asks why the standard names the parents specifically.
Boundaries respected. No item asks students to graph a transformed parabola or (A.F.2c, Chapter 16), to write an exponential model from scratch beyond recognizing or a simple growth pattern already visible in a table (A.F.2e–f, Chapter 17), or to determine a curve of best fit with technology (A.ST.1, Chapter 19). Bases are natural numbers. Comparisons stay with the parents , , and named in A.F.2h.
Answer keys for every item in this chapter are in Appendix A.