Chapter 9 — Linear Inequalities in Two Variables and Their Systems
Standard: A.EI.2 (d, e, f, g, h)
A.EI.2 — verbatim. The student will represent, solve, explain, and interpret the solution to a system of two linear equations, a linear inequality in two variables, or a system of two linear inequalities in two variables. Students will demonstrate the following Knowledge and Skills: d) Create a linear inequality in two variables to represent a contextual situation. e) Represent the solution of a linear inequality in two variables graphically on a coordinate plane. f) Create a system of two linear inequalities in two variables to represent a contextual situation. g) Represent the solution set of a system of two linear inequalities in two variables, graphically on a coordinate plane. h) Verify possible solution(s) to a system of two linear equations, a linear inequality in two variable, or a system of two linear inequalities algebraically, graphically, and with technology to justify the reasonableness of the answer(s). Explain the solution method and interpret solutions for problems given in context.
By the end of this chapter you will be able to:
- Decide by substitution whether an ordered pair is a solution of a linear inequality in two variables, and explain why a solution is a pair rather than a single number (A.EI.2e, A.EI.2h)
- Graph the solution set of a linear inequality in two variables as a half plane, choosing a dashed or solid boundary correctly and shading the correct side (A.EI.2e)
- Create a linear inequality in two variables from a contextual situation, defining both variables in full sentences with units (A.EI.2d)
- Create a system of two linear inequalities in two variables from a contextual situation (A.EI.2f)
- Graph the solution set of a system of two linear inequalities as the overlap of two half planes, and locate the corner where the two boundaries meet (A.EI.2g)
- Verify a candidate solution three ways — algebraically by substitution, graphically by looking at the shading, and with technology — and treat a disagreement between them as information (A.EI.2h)
- Explain your solution method and interpret a solution, a boundary point, and a corner in the language and units of the situation (A.EI.2h)
Lessons: 9.1 From an Interval to a Region · 9.2 Graphing a Linear Inequality in Two Variables · 9.3 Writing an Inequality from a Situation · 9.4 Systems of Two Linear Inequalities · 9.5 Verifying and Interpreting Solutions
Why this chapter matters. Chapter 8 asked two linear equations one question — where do these two lines meet? — and got back, in the ordinary case, a single point. Real situations are rarely that tidy. A budget does not say "spend exactly eighty dollars"; it says at most eighty. A work schedule does not say "work exactly twelve hours"; it says no more than twelve, while earning at least ninety-six dollars. Those two sentences together do not pick out a point. They pick out a region of the plane, every point of which is a workable plan. Learning to draw that region, and to check that a particular plan really is inside it, is the last piece of linear modelling in this course — and it is the piece that gets used, under the name feasible region, in every field that has to work inside limits.
Scope note. This chapter graphs one linear inequality in two variables and systems of exactly two of them, which is what A.EI.2 d through g allow. Systems of two linear equations — solving them by graphing, substitution, and elimination, and classifying how many solutions they have — are A.EI.2 a, b, and c, in Chapter 8. This chapter builds directly on that work and reuses its vocabulary, but it does not re-teach it. Linear inequalities in one variable, solved algebraically and graphed on a number line, are A.EI.1c, in Chapter 3; that chapter is prior knowledge here, and the single most important thing carried forward from it is the reversal rule. Writing the equation of a line is A.F.1 d and e, in Chapter 6, and graphing a linear function is A.F.1f, in Chapter 7; both are assumed, not retaught. Bullet h is deliberately shared with Chapter 8: the same three-way verification habit is applied there to systems of equations and here to inequalities.
Conventions this chapter fixes.
- A solution of a linear inequality in two variables is an ordered pair that makes the inequality true. The solution set is every such pair at once, and it is drawn as a shaded half plane, not listed.
- The boundary is the line you get by replacing the inequality symbol with . A strict symbol, or , gets a dashed boundary, because its points are not solutions. An inclusive symbol, or , gets a solid boundary, because its points are. This is the two-variable version of Chapter 3's open circle and closed circle: the same question — is the boundary itself a solution? — asked about a whole line instead of a single number.
- The side to shade is decided by a test point, never by the direction the symbol happens to point. The origin is the test point of choice whenever the boundary does not pass through it.
- Every shaded region in this chapter is accompanied by at least one substitution. A picture without a substitution is a guess; a substitution without a picture answers only about one point. A.EI.2h asks for both, and for a technology check besides.
- This course is not calculator-free, and A.EI.2h names technology explicitly. A graphing tool is used here as an instrument of verification: you produce the algebraic result and the hand-drawn region first, then confirm them, and a disagreement is treated as information about which step to re-examine.
- In a contextual model, the variables are defined in full sentences with units, and the restrictions and are stated whenever the quantities cannot be negative.
- Item numbering runs straight through the chapter, from 1 in Lesson 9.1 to 118 at the end of the review. It does not restart at each lesson.
Lesson 9.1 — From an Interval to a Region
What changes when a second variable arrives
In Chapter 3 you solved inequalities such as and graphed the answer on a number line. A solution was a single number, and the solution set was an interval, drawn as a shaded ray with an open or a closed circle at its end.
A linear inequality in two variables looks like
and it asks a different question. It is a sentence about two numbers at once, so a solution is an ordered pair, and the set of all solutions is a region of the plane.
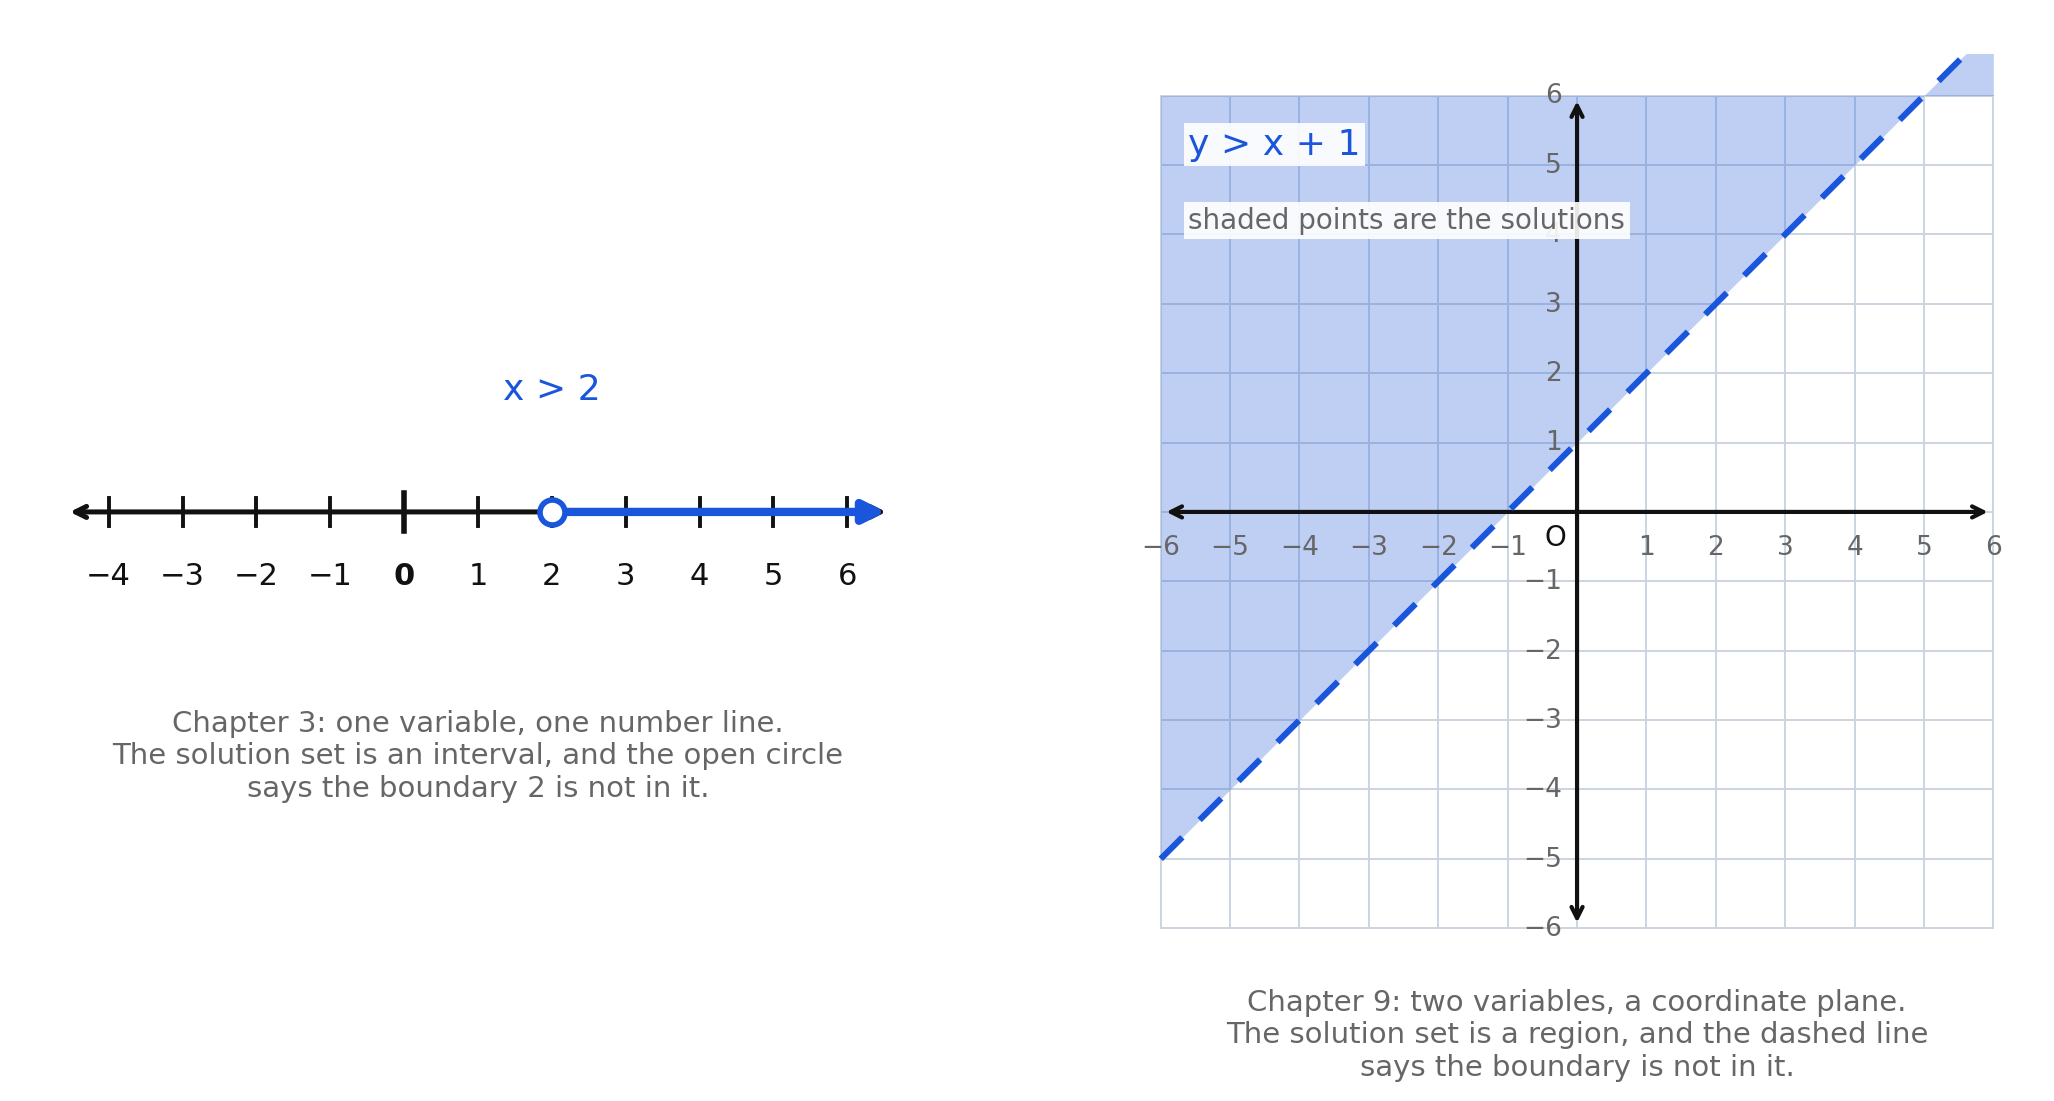
The two pictures are doing the same job in different dimensions.
| Chapter 3 | Chapter 9 | |
|---|---|---|
| Variables | one | two |
| A solution is | a number | an ordered pair |
| Drawn on | a number line | a coordinate plane |
| The solution set is | an interval, a shaded ray | a region, a shaded half plane |
| The boundary is | a single point | a whole line |
| Boundary excluded | open circle | dashed line |
| Boundary included | closed circle | solid line |
Read the table down the last two rows especially. The open circle and the closed circle did not disappear; they grew. Where Chapter 3 had to decide whether one number belonged to the answer, this chapter has to decide whether every point of a line does.
Deciding whether a pair is a solution
There is exactly one test, and it is substitution.
To check an ordered pair. Replace with the first coordinate and with the second, evaluate both sides, and read whether the resulting numerical sentence is true or false. True means the pair is a solution. False means it is not.
Is a solution of ? Substituting gives , that is , which is true. Yes.
Is a solution of ? Substituting gives , and is false. No.
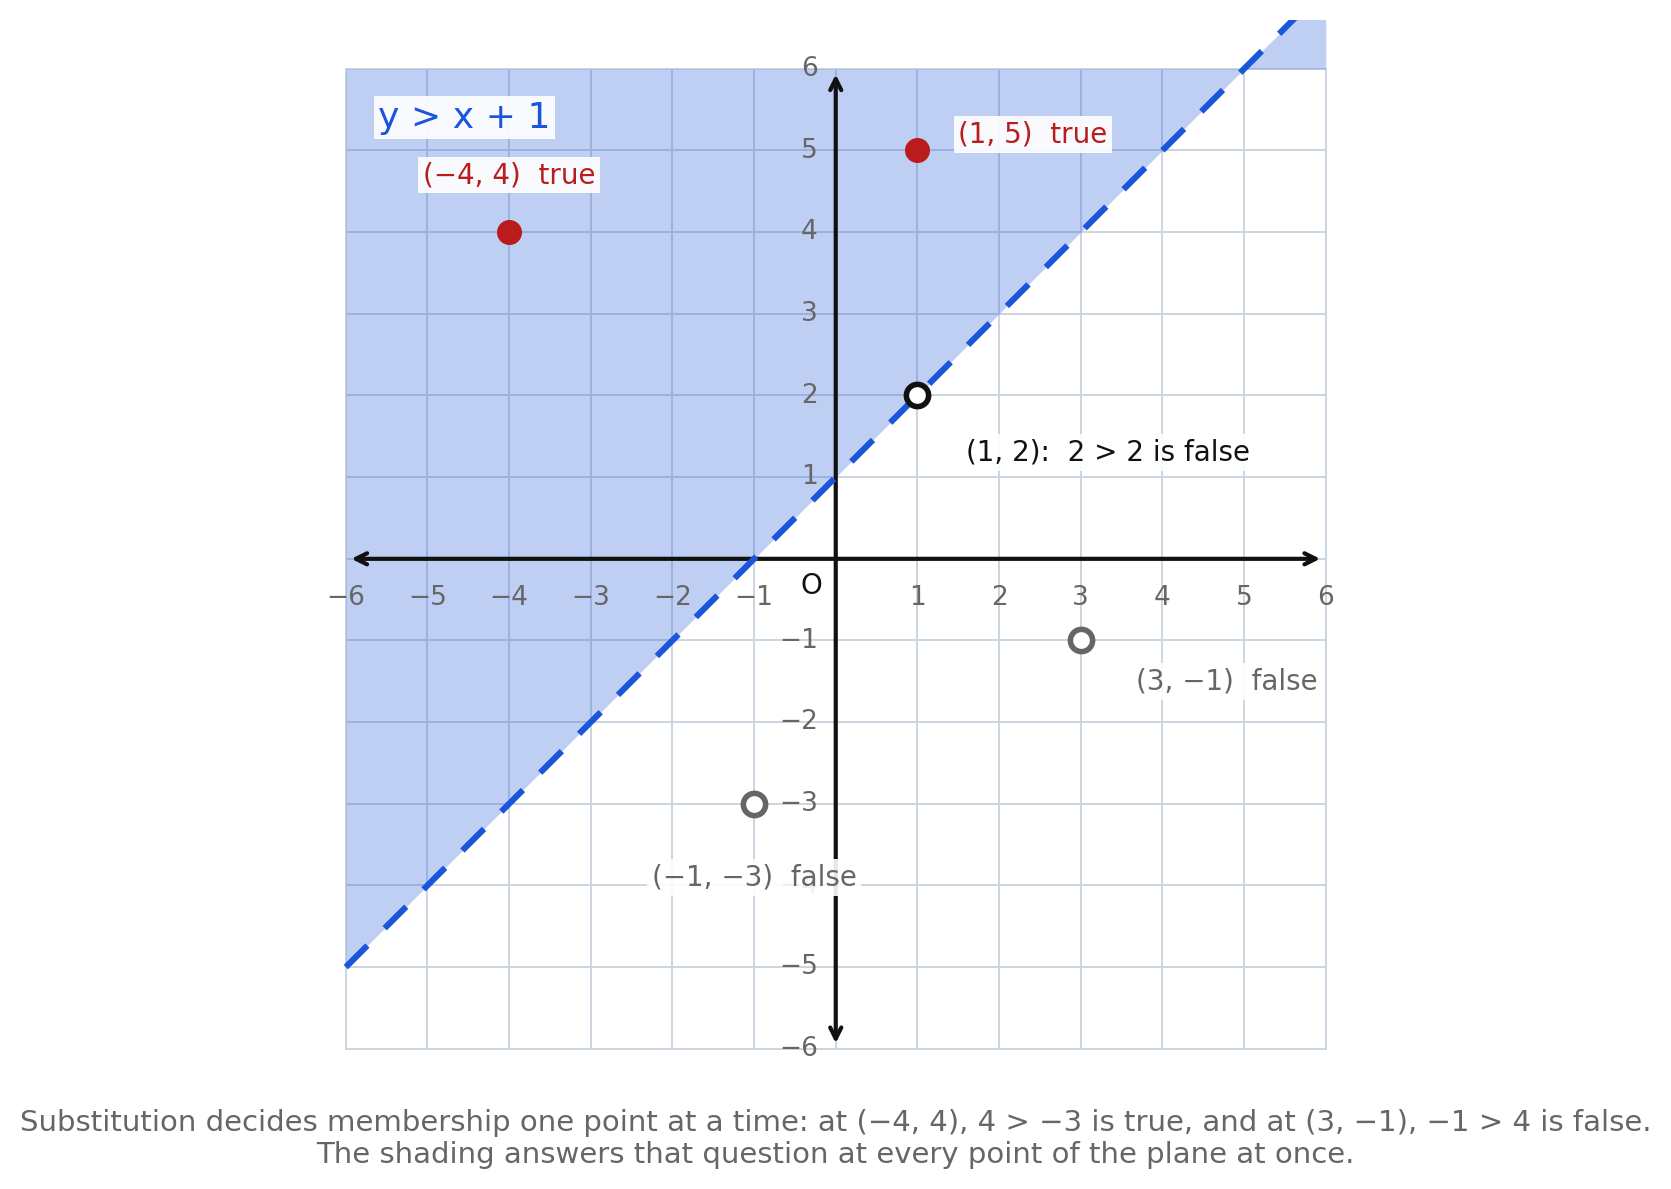
The figure runs that test at five points of the plane at once.
- : , that is . True, and the point sits in the shaded region.
- : . True, and again the point is shaded.
- : . False, and the point sits in the unshaded region.
- : . False, unshaded.
- : . False — and this point is on the boundary itself.
That last one is the whole reason the boundary is drawn dashed. The line is where the sentence changes from true to false, and for a strict symbol the changeover line belongs to neither side.
The shading is the answer to the substitution question at every point at once. That is what a region buys you: instead of testing pairs one at a time forever, you draw the boundary once and shade the side that passes.
Dashed or solid
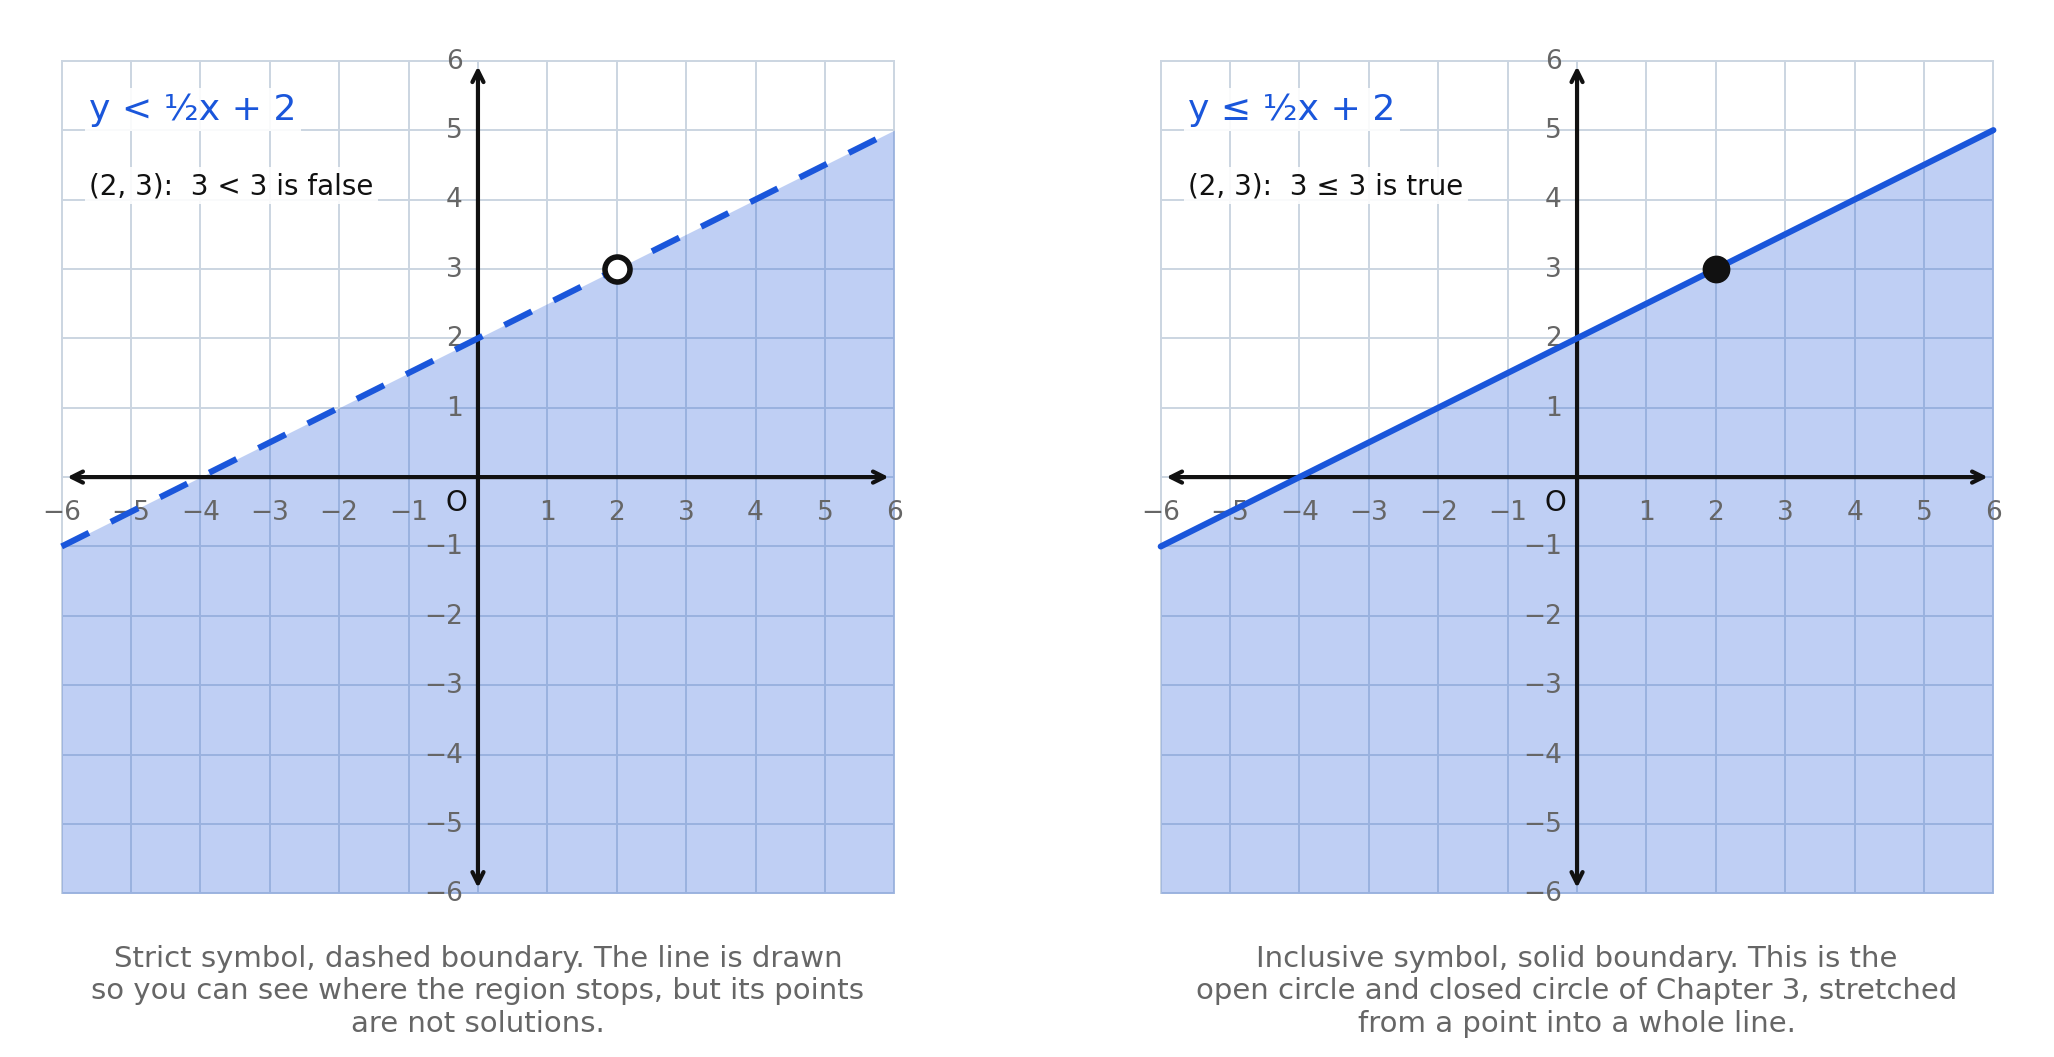
Both panels shade the same side of the same line. They differ by exactly one thing: whether the line itself is part of the answer.
- Left: . At the boundary point , the sentence reads , which is false. The boundary is excluded, so it is dashed.
- Right: . At the same point, is true. The boundary is included, so it is solid.
The line is drawn either way, because you need to see where the region stops. Drawing it dashed is how you say "here is the edge, and the edge is not included" — the same message the open circle carried on a number line.
Worked examples
Example 1 — A pair that works
Is a solution of ?
Substitute: , so .
Answer: Yes; is true.
Example 2 — A pair that does not
Is a solution of ?
Substitute: , and the sentence reads .
Answer: No; is false.
Example 3 — A pair on the boundary, inclusive symbol
Is a solution of ?
Substitute: , and the sentence reads .
Answer: Yes. The pair sits exactly on the boundary, and admits equality, so it is a solution and the boundary is solid.
Example 4 — The same pair, strict symbol
Is a solution of ?
The arithmetic is identical, but the sentence is now .
Answer: No. Nothing changed but the symbol, and that one change removes the entire boundary line from the solution set.
Example 5 — Sorting three pairs at once
Which of , , and are solutions of ?
and is true. and is false. and is true.
Answer: and are solutions; is not.
Guided practice
- Use the figure comparing a number line with a coordinate plane. Say what a solution of is and what a solution of is, and explain how the two solution sets differ.
- In that same figure, decide whether is a solution of , showing the substitution.
- Use the figure with five labeled test points. Name two solutions and two non-solutions it shows, and say how the picture tells you which is which.
- In that same figure, is marked with a hollow dot. Explain why it is not a solution even though it lies on the boundary line.
- Is a solution of ? Show the substitution.
- Is a solution of ? Show the substitution.
Independent practice
- Decide whether each ordered pair is a solution of , showing each substitution. a) b) c) d)
- Decide whether each ordered pair is a solution of , showing each substitution. a) b) c) d)
- Use the figure comparing a dashed boundary with a solid one. Which panel has as a solution? Explain what the two boundary styles mean, and name the Chapter 3 convention each one grew out of.
- Reasoning. Explain why the solution set of a linear inequality in two variables cannot be listed the way a solution of a linear equation in one variable can be, and why a picture is the usual way to report it.
- Give three different solutions of , and show the substitution that confirms one of them.
- Error analysis. A student says is a solution of "because the point is on the line, and the line is part of the graph." Test the pair, identify the error, and say what would have to change about the inequality to make the student right.
- Application. A basketball team scores two-point baskets and three-point baskets and needs at least points, so . Decide whether is a solution, and say what your answer means about that game.
- Use the figure with five labeled test points. The pair is marked as a solution. Write the substitution that proves it.
Exit ticket 9.1
- Is a solution of ? Show the substitution.
- Is a solution of ? Show the substitution.
- Explain in one or two sentences when a boundary is drawn dashed and when it is drawn solid, and name the Chapter 3 convention each corresponds to.
- Explain why a solution of a linear inequality in two variables is an ordered pair rather than a single number.
Lesson 9.2 — Graphing a Linear Inequality in Two Variables
Four steps
Graphing a linear inequality in two variables is graphing one line and then answering one yes-or-no question about which side to shade.
- Solve for if the inequality is not already in that form — and ask the reversal question at every multiplication or division by a negative number, exactly as in Chapter 3.
- Graph the boundary. Replace the inequality symbol with and graph that line, using slope and intercept or using both intercepts. Draw it dashed for or and solid for or .
- Test a point that is not on the boundary. The origin is easiest, whenever the boundary misses it.
- Shade the side the test point is on if the test came out true, and the other side if it came out false.
Step 3 is the one that matters
It is tempting to shade above for and below for and skip the test. That shortcut is right only when the inequality has already been solved for , and it fails silently the moment it is not — which is exactly the situation Chapter 3's reversal rule warned you about.
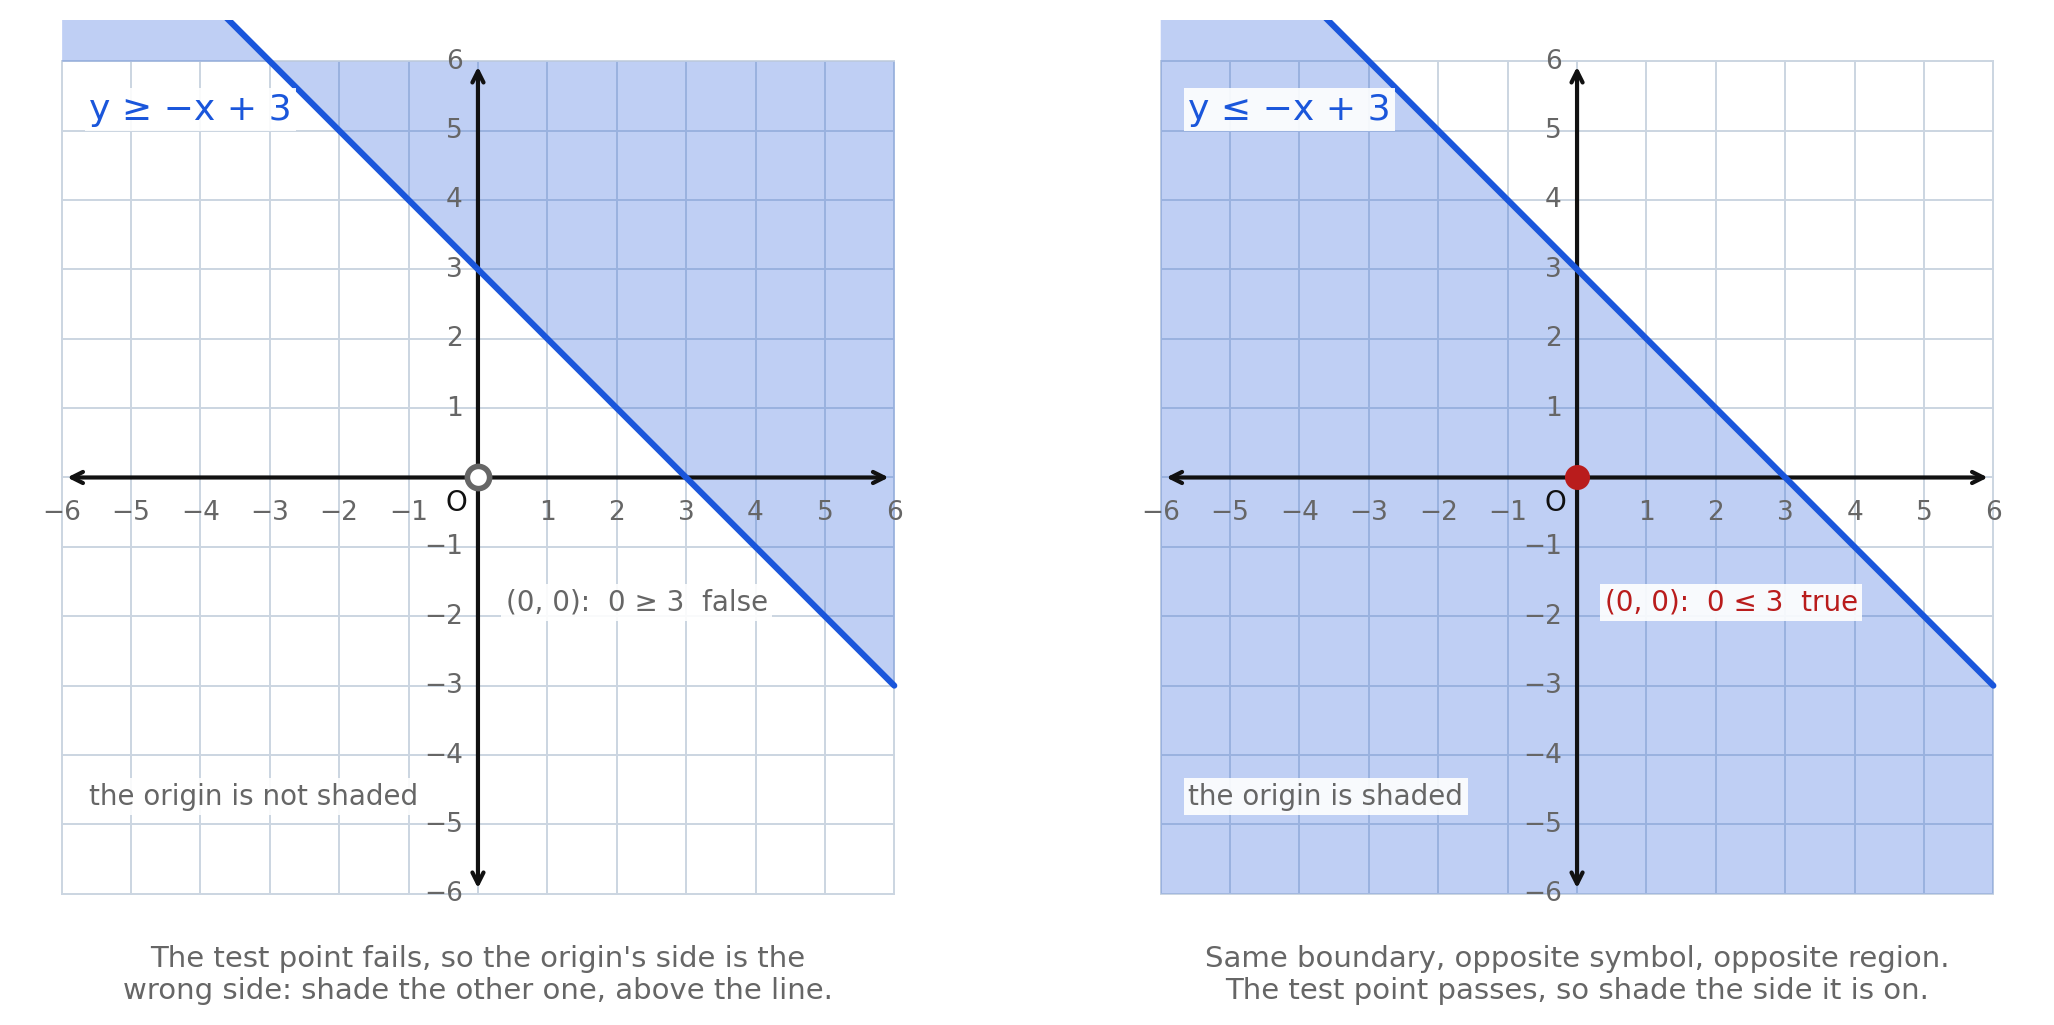
Both panels draw the same solid line . The origin decides between them.
- Left: . At , is false, so the origin's side is the wrong side, and the region above the line is shaded.
- Right: . At , is true, so the origin's side is the right side, and the region below is shaded.
One test point settles a whole half plane, because a linear inequality cannot change its truth value without crossing the boundary.
Graphing from standard form
An inequality written as does not have to be solved for at all. Chapter 5 showed that standard form hands you both intercepts cheaply, and two points are all a line needs.
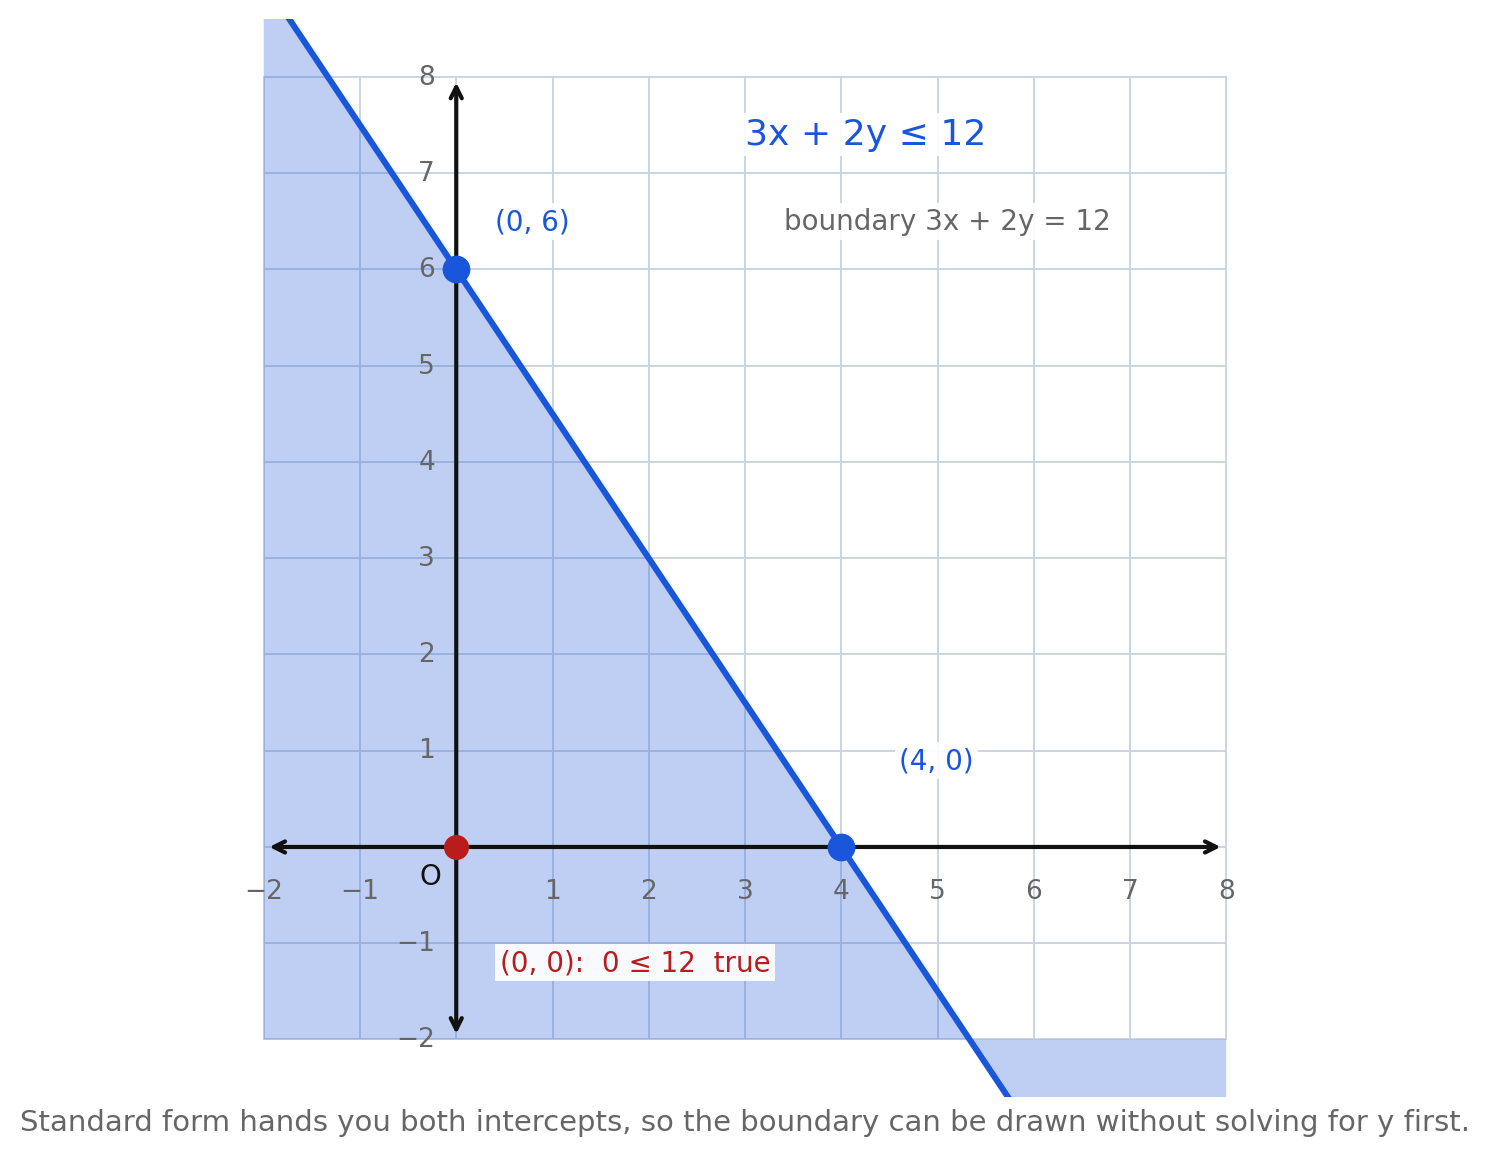
For :
- Boundary . Let : , so . Let : , so . Draw the line through those two points, solid, because the symbol is .
- Test : , and is true.
- Shade the origin's side.
Substituting into the standard form directly, without solving for first, is less work and removes the one step where a sign can go wrong.
The reversal rule, in two variables
When solving for requires dividing by a negative number, the symbol reverses — the same rule, for the same reason, as in Chapter 3.
For :
So the boundary is , drawn dashed, and the region below it is shaded. Check with the origin in the original inequality: , and is false, so the origin is not in the region — and the origin does sit above the line , since and . The two conclusions agree, which is exactly what a test point is for.
Forgetting the reversal here produces a picture that is shaded on precisely the wrong side, and the origin test catches it every time.
Boundaries with only one variable
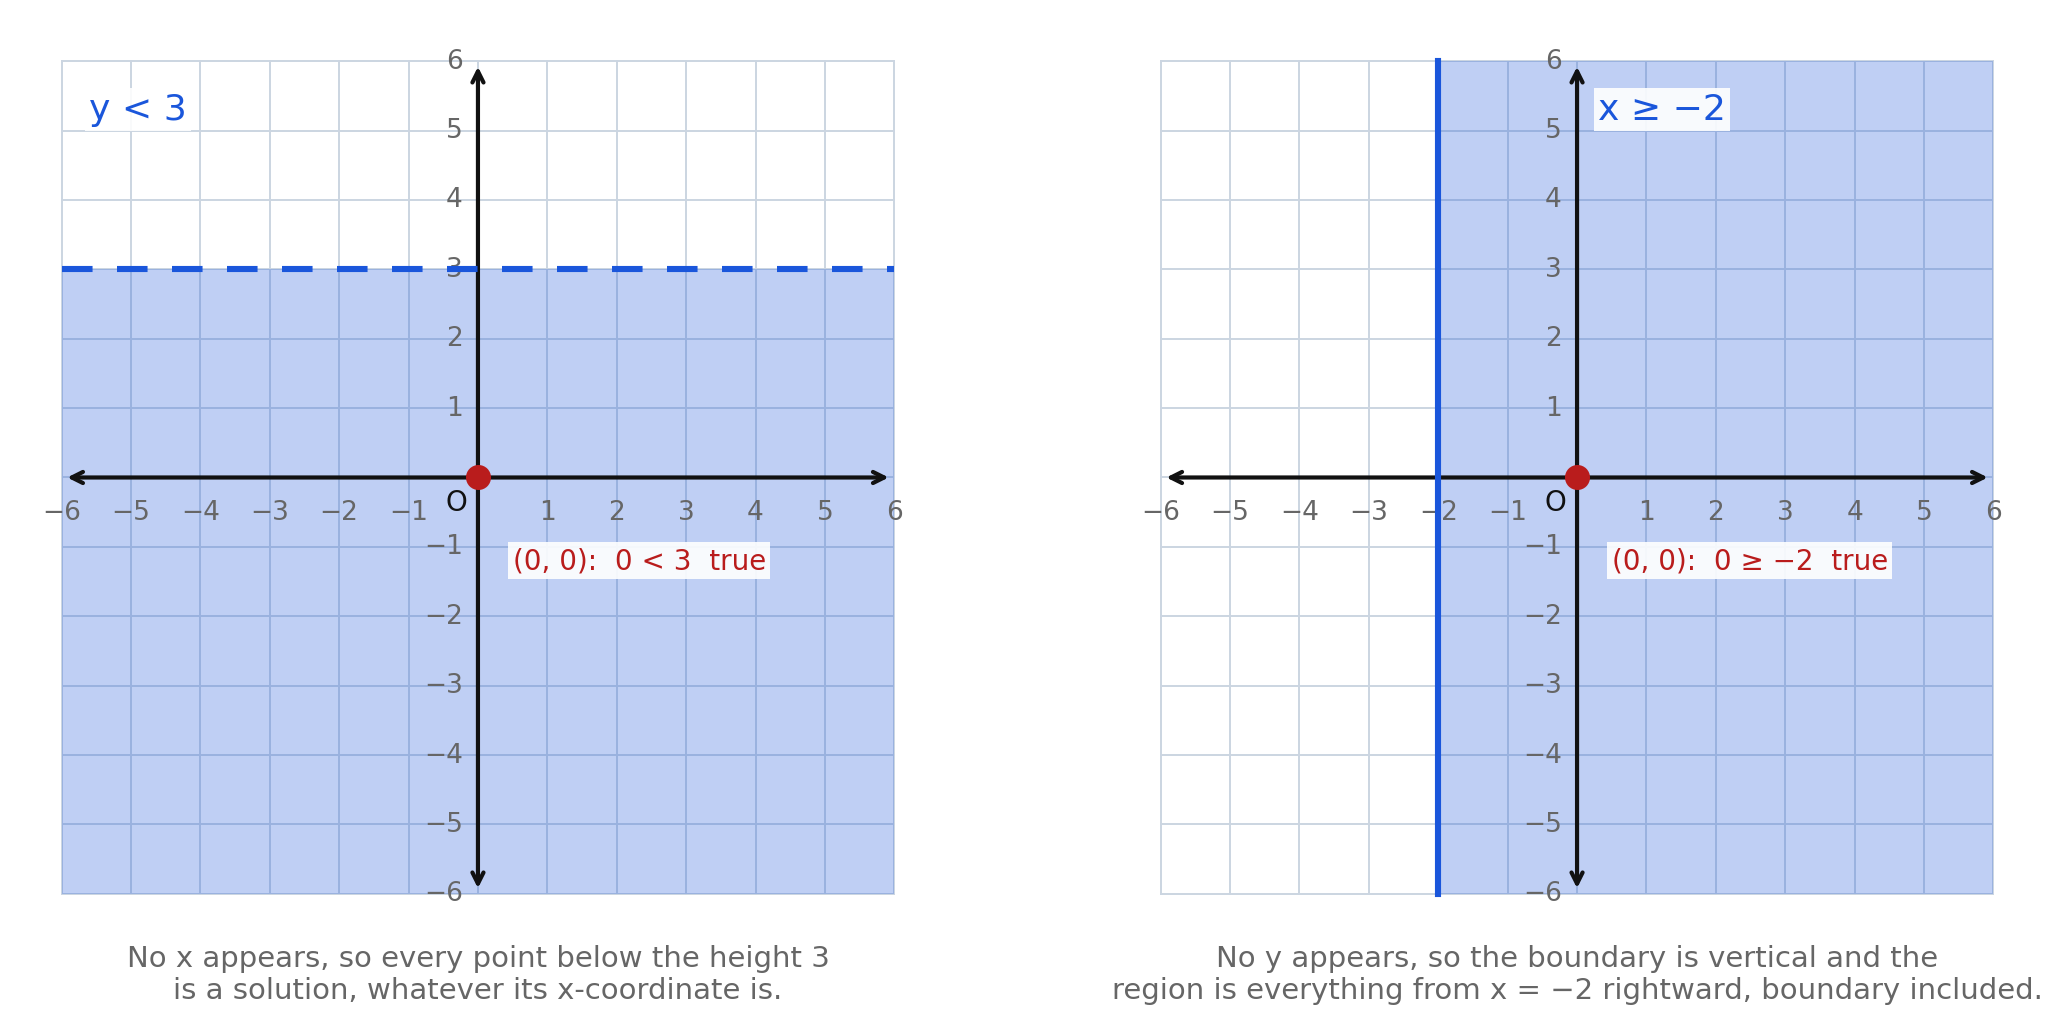
Some inequalities name only one of the two variables, and they behave exactly as you would hope.
- has the horizontal boundary , drawn dashed, with everything below it shaded. No appears, so the -coordinate of a point is irrelevant: any point lower than height qualifies.
- has the vertical boundary , drawn solid, with everything to its right shaded. This is the case slope-intercept form cannot express — Chapter 5's vertical line, back again.
Both are still inequalities in two variables: is short for , and its solution set is a region of the plane, not an interval of the -axis.
Reading an inequality off a graph
Run the four steps backwards.
- Find the slope and -intercept of the boundary, and write its equation.
- Look at the line style: dashed means or , solid means or .
- Look at which side is shaded: above means or , below means or , once the boundary is written as .
- Confirm by testing one shaded point in the inequality you wrote.
A dashed boundary through and with the region below shaded has slope , so the boundary is and the inequality is . Testing the shaded point : is true.
Worked examples
Example 1 — Already solved for
Graph .
Boundary , dashed because the symbol is strict, with -intercept and slope . Test : is true, so shade the origin's side, which is above the line.
Answer: A dashed line through and , with the region above it shaded.
Example 2 — Inclusive, negative slope
Graph .
Boundary , solid, through and . Test : is true, so shade below.
Answer: A solid line through and , with the region below it shaded.
Example 3 — Standard form
Graph .
Boundary , solid, with intercepts and . Test : is false, so shade the side away from the origin.
Answer: A solid line through and , with the region above and to the right of it shaded.
Example 4 — A reversal
Graph .
Solving for gives , then , with the symbol reversed by the division by . Boundary , dashed, through and . Test in the original: is false, so shade the side away from the origin, which is below the line.
Answer: A dashed line through and , with the region below it shaded.
Example 5 — A boundary through the origin
Graph .
Boundary , solid, through the origin. The origin is on the boundary, so it cannot be the test point. Use instead: is true, so shade the side containing .
Answer: A solid line through and , with the region containing — above and to the right of the line — shaded.
Guided practice
- Use the left panel of the figure showing two shadings of one boundary. Which region is shaded for , and what did the test point report?
- Use the right panel of that same figure. Which region is shaded for , and what did report there?
- Graph . State the boundary, its line style, the test point you used, and the side you shaded.
- Graph . State the boundary, its line style, the test point, and the side.
- Use the standard-form figure. Give both intercepts of the boundary , and show the test-point substitution that decides the shading.
- Use the figure with a horizontal boundary and a vertical one. Describe the boundary line and the shaded region for and for .
Independent practice
- Graph each inequality. For each, state the boundary, whether it is dashed or solid, the test point you used, and which side you shaded. a) b) c) d)
- In part b of the previous item, the origin cannot be used as the test point. Explain why, and name a point that can be used instead.
- Graph . Show the step that reverses the symbol and name the property that authorizes it.
- Graph using both intercepts, and show the origin test.
- Graph and as two separate inequalities. For each, describe the boundary and the shaded region.
- A graph has a dashed boundary through and , with the region below it shaded. Write the inequality, and confirm it with one shaded point.
- A graph has a solid boundary through and , with the region above it shaded. Write the inequality, and confirm it with one shaded point.
- Reasoning. Explain why the origin is the most convenient test point, and describe the one situation in which it cannot be used.
- Error analysis. A student graphs with a solid boundary and shades below it. Identify both errors, and use the test point to show that the shading is wrong.
- Application. A student has for supplies and buys calculators at each and storage boxes at each, so . Give both intercepts of the boundary, graph the inequality, and explain why only the first-quadrant part of the half plane is drawn.
Exit ticket 9.2
- Graph , stating the line style and the shaded side.
- Graph . Show the step that reverses the symbol, and confirm the shading with the origin.
- Graph , describing the boundary and the region.
- Explain the four steps for graphing a linear inequality in two variables, and say which step the reversal rule belongs to.
Lesson 9.3 — Writing an Inequality from a Situation
From words to a sentence about two quantities
A.EI.2d asks you to create the inequality, not just graph one you were handed. The work has three parts, and the first is the one most often skipped.
- Define both variables in a full sentence, with units. Not " = bands" but " is the number of ride bands bought." A model whose variables are not defined cannot be interpreted afterward, and interpretation is half of what A.EI.2h asks for.
- Write the expression each variable contributes, then combine them. Five dollars per ride band and ride bands contribute dollars.
- Choose the symbol from the phrase. This is a translation, and the four phrases below are the ones that appear.
| Phrase | Symbol | Boundary |
|---|---|---|
| at most, no more than, cannot exceed, up to | solid | |
| at least, no less than, a minimum of | solid | |
| less than, under, fewer than | dashed | |
| more than, over, exceeds | dashed |
The first two rows include the boundary because the phrase allows the exact value: spending at most permits spending exactly . The last two exclude it: raising more than does not count if you raise exactly .
A budget, drawn
A student takes to a fair. Ride bands cost each and game passes cost each, and the student cannot spend more than what they brought.
- Let be the number of ride bands bought.
- Let be the number of game passes bought.
Then is the money spent on bands and the money spent on passes, so the total spent is dollars and the model is
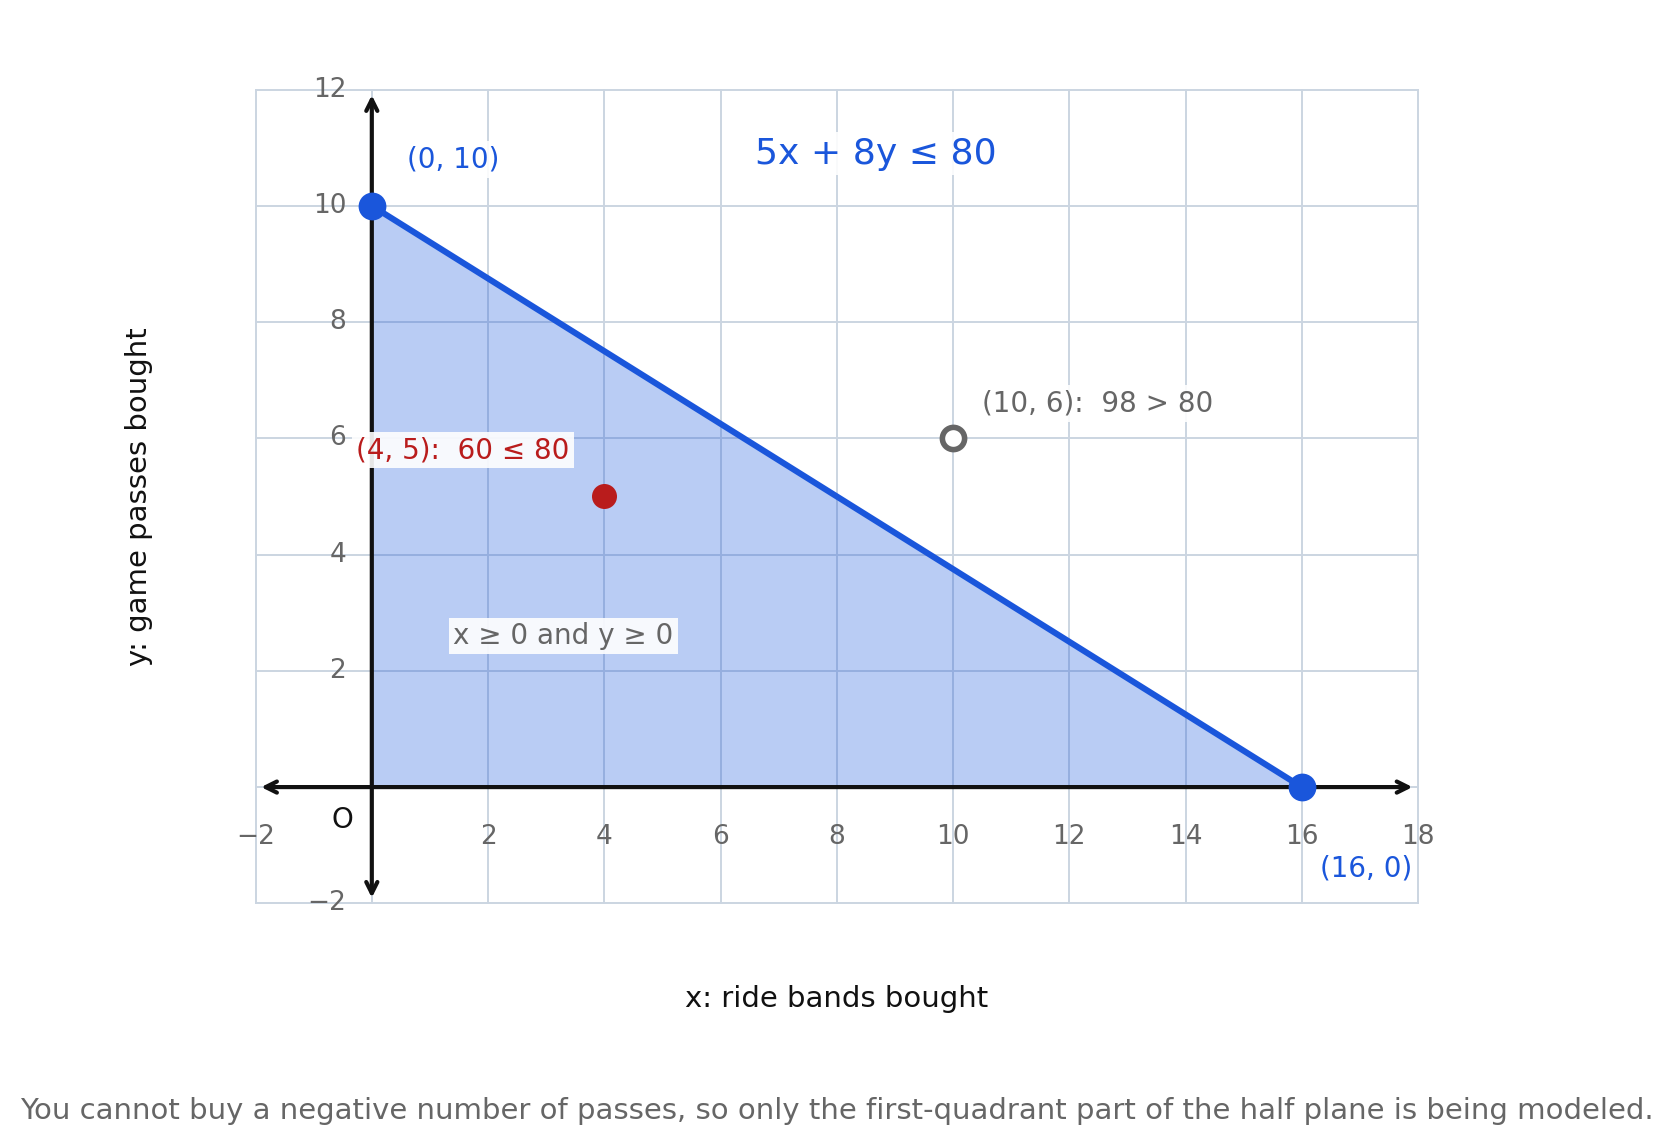
The picture is a triangle, not a half plane, and the reason is the situation rather than the algebra. The inequality is satisfied by and by , but nobody buys a negative number of ride bands. Two more restrictions come with the story:
Together they cut the half plane down to its first-quadrant part. This is where the first-quadrant restriction earns its keep: it is not a rule about graphing, it is a fact about the situation.
Read the region.
- is inside: , and . Four bands and five passes cost , which is affordable, with left over.
- is outside: , and is false. That purchase costs , which the student cannot afford.
- is on the boundary: exactly. Sixteen bands and no passes spends every dollar, and because the symbol is , that is allowed.
- is the other boundary point: ten passes and no bands, also exactly .
What the intercepts mean
In a context, the intercepts of the boundary are the two most quotable facts the model produces, exactly as in Chapter 5. Each answers a question of the form what if I buy only one kind?
- : spend the whole budget on ride bands, and you can buy .
- : spend the whole budget on game passes, and you can buy .
One more caution: whole numbers
Ride bands come in whole numbers, so the honest solution set of this model is the lattice points — the corner points of the grid — inside the shaded triangle, not the whole shaded area. This volume shades the region, as A.EI.2e asks, and then interprets in whole numbers when the story requires it. If a question asks how many bands can be bought alongside passes, the answer comes from , so and , which means at most bands.
Worked examples
Example 1 — At most
A club has for supplies and buys pens at each and notebooks at each, spending at most . Write the inequality.
Answer: , with and . Here is the number of pens bought and the number of notebooks bought; the boundary is solid because "at most" permits spending exactly .
Example 2 — At least
A student tutors for an hour and works at a shop for an hour, and needs to earn at least this week. Write the inequality.
Let be the number of hours spent tutoring and the number of hours worked at the shop.
Answer: , with and , boundary solid.
Example 3 — More than
A fundraiser sells tickets at and sponsorships at , and must raise more than . Write the inequality.
Answer: , with and . The boundary is dashed, because raising exactly does not satisfy "more than."
Example 4 — A capacity, not a cost
A van can carry at most kilograms. Crates weigh kg each and boxes weigh kg each. Write the inequality.
Let be the number of crates loaded and the number of boxes loaded.
Answer: , with and , boundary solid.
Example 5 — Interpreting a point
For the fair model , decide whether is affordable and say what it means.
, and is true.
Answer: Yes, and exactly so: eight ride bands and five game passes cost precisely , spending the entire budget. The pair lies on the boundary, which is included because the symbol is .
Guided practice
- Use the fair-budget figure. State what says about the situation, and define and in full sentences with units.
- In that same figure, explain why the shaded region is a triangle rather than a whole half plane, and name the two extra restrictions responsible.
- In that same figure, decide whether is affordable, showing the arithmetic, and say what your answer means.
- Choose the correct symbol for each phrase, and say whether the boundary is dashed or solid: "no more than," "at least," "fewer than," "at most."
- A student tutors for an hour and works at a shop for an hour, and needs at least . Write the inequality.
- Define the two variables of the previous item in full sentences with units, and state the two restrictions the situation adds.
Independent practice
- Write an inequality for each situation, defining both variables in full sentences with units. a) A club has and buys pens at each and notebooks at each, spending at most . b) A van carries at most kg, with crates of kg and boxes of kg. c) A team must score more than points using three-point baskets and two-point baskets. d) A worker wants at least hours a week across two jobs.
- Application. A student has for a fair, where ride bands cost and game passes cost . Write the inequality, define both variables, and name two purchases that satisfy it and one that does not, with the arithmetic for each.
- Application. For the fair model, suppose exactly game passes are bought. Find the greatest number of ride bands the student can also buy, and show the work.
- Explain why and accompany nearly every contextual model in this lesson, and describe what those two restrictions do to the picture.
- Reasoning. Explain the difference between "spends at most " and "spends less than " for the fair model. Say which boundary style each requires and name one purchase the two models disagree about.
- For each inequality you wrote in item 45, state whether the boundary is dashed or solid, and quote the phrase that decided it.
- Error analysis. For the fair, a student writes and says "the purchase is affordable." Identify what went wrong, and write the correct inequality.
- Application. Find both intercepts of the boundary , and interpret each one in a sentence about the fair, with units.
Exit ticket 9.3
- Write an inequality for: a student practices at most hours a week, split between piano and guitar. Define both variables.
- Write an inequality for: a bake sale sells cookies at and pies at and must raise more than .
- Define the two variables of the previous item in full sentences with units, and say whether the boundary is dashed or solid and why.
- Application. For the practice model of item 53, decide whether is possible, and say what your answer means.
Lesson 9.4 — Systems of Two Linear Inequalities
Two sentences, both true at once
A system of two linear inequalities in two variables is two inequalities considered together. A pair is a solution of the system when it satisfies both — not one, not either, both. That single word is the whole idea, and it is the same word Chapter 8 used for a system of two equations.
Graphing the system means graphing each inequality by the four steps of Lesson 9.2 and then keeping only the part of the plane that both shadings cover.
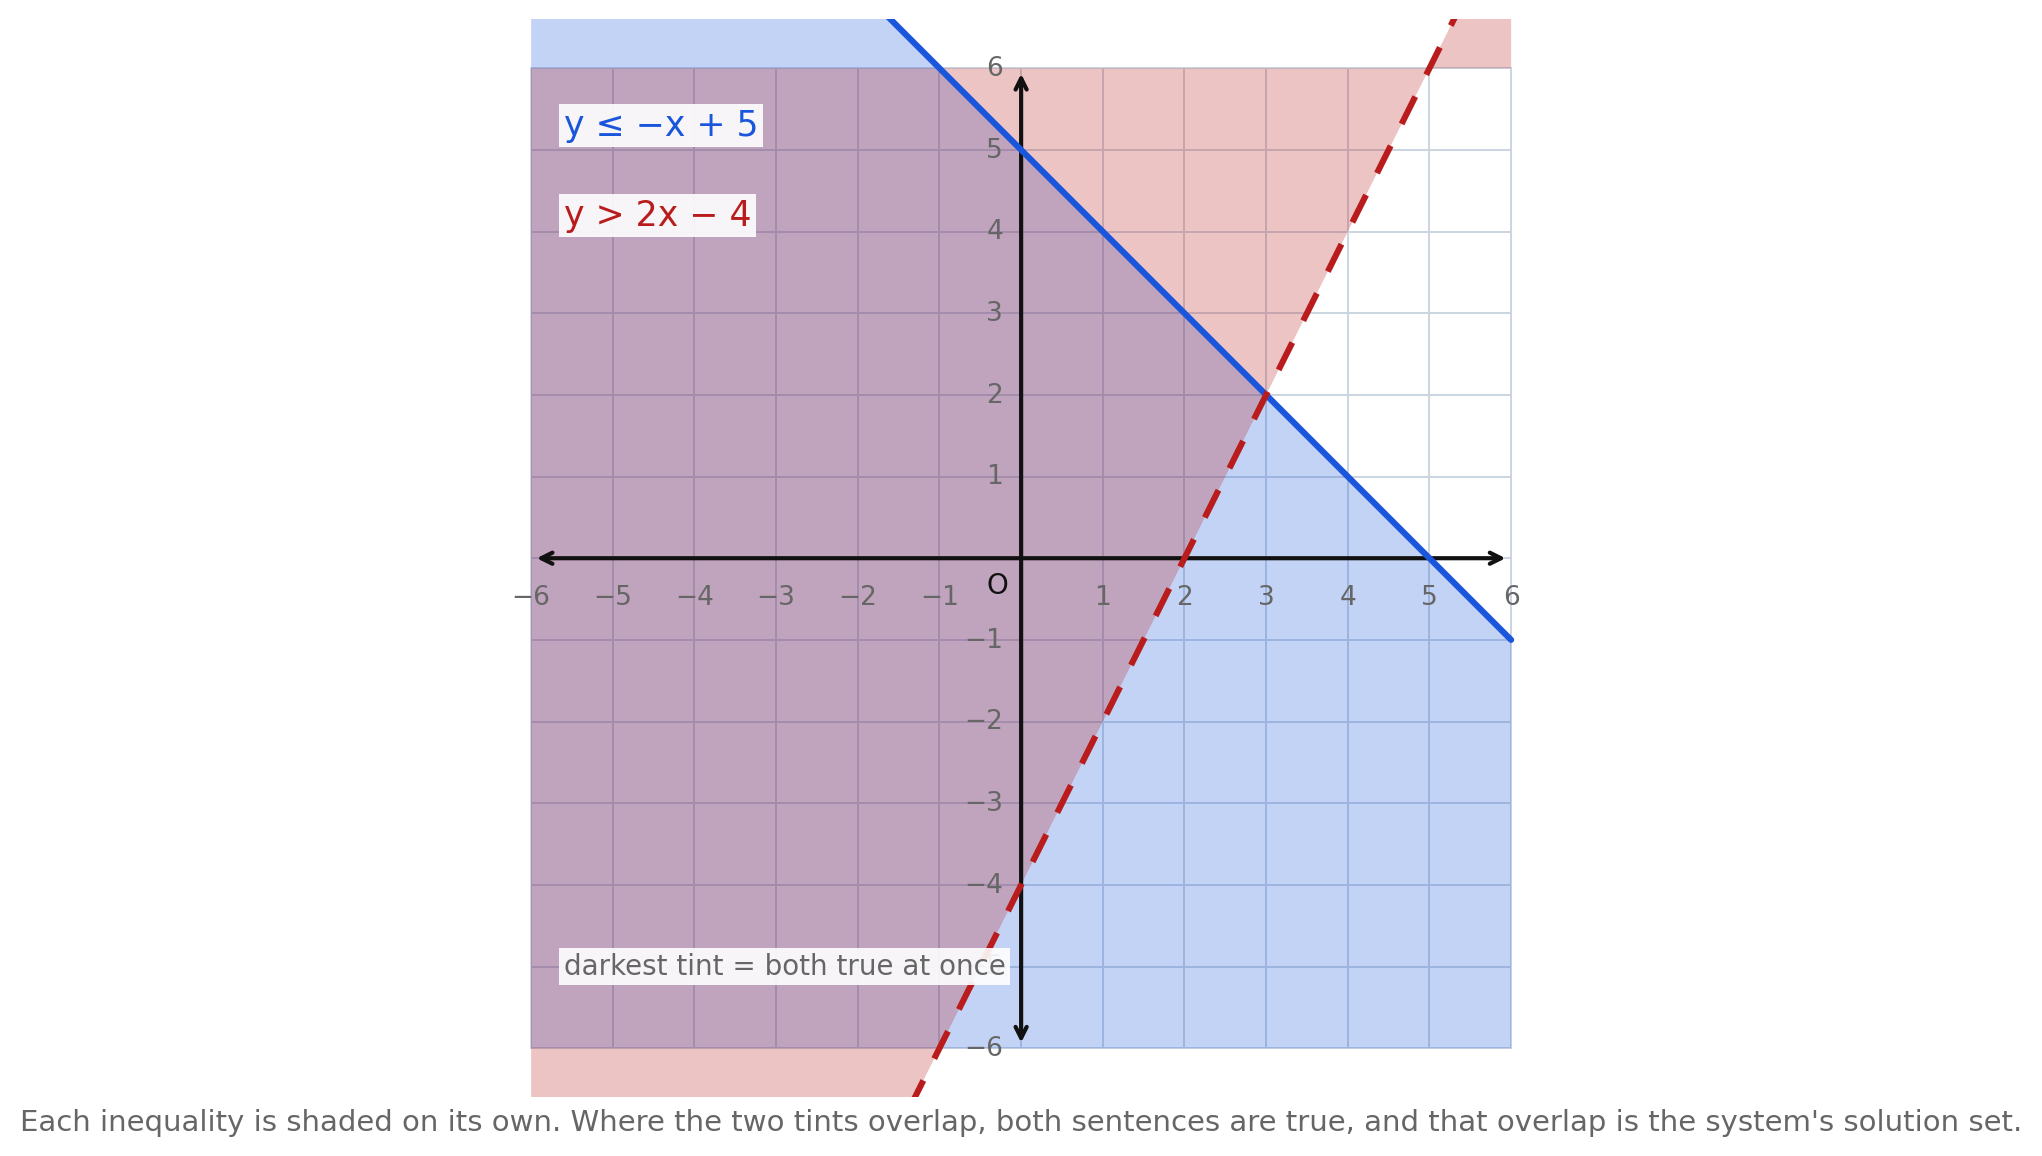
Each inequality is shaded on its own, in its own color. Where the two tints overlap, both sentences are true — and that overlap, and nothing else, is the solution set of the system.
The overlap, alone
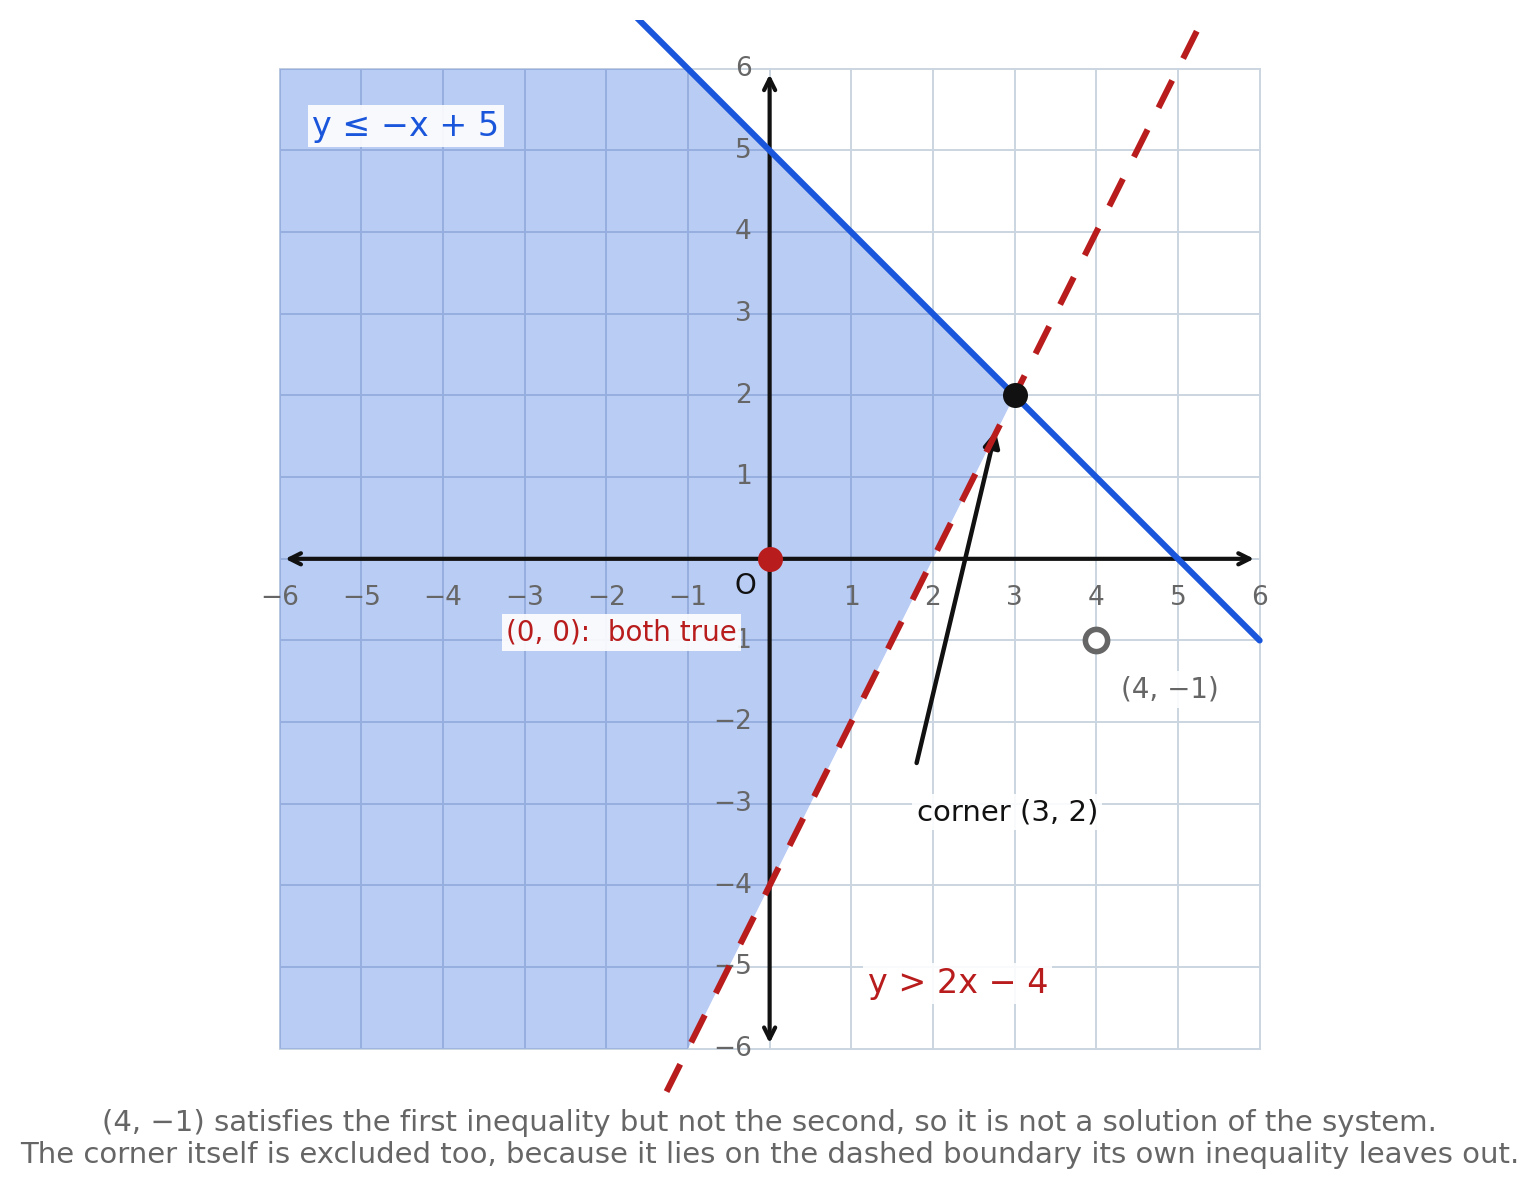
Drawing the overlap by itself is the clearest way to report the answer, and it is what "represent the solution set graphically" in A.EI.2g is asking for.
Two features are worth naming.
The corner. The two boundaries meet where , so and , giving . The corner is — and finding it is exactly the Chapter 8 skill of solving a system of two linear equations. That is the connection between the chapters: the corners of an inequality region are the solutions of the systems of equations formed by its boundaries.
Whether the corner is itself a solution depends on the boundary styles. Here satisfies but not , so the corner is excluded, which the dashed boundary shows.
Points that satisfy only one. At : the first inequality gives , true; the second gives , false. One out of two is not enough. The point sits in the red shading alone, outside the overlap, and it is not a solution of the system.
Systems built from a situation
A.EI.2f asks you to create a system from a context, and the natural source is a situation with two separate limits pulling in opposite directions.
A student can work at most hours next week. Babysitting pays an hour and tutoring pays an hour, and the student needs to earn at least .
- Let be the number of hours spent babysitting.
- Let be the number of hours spent tutoring.
with and , because hours cannot be negative.
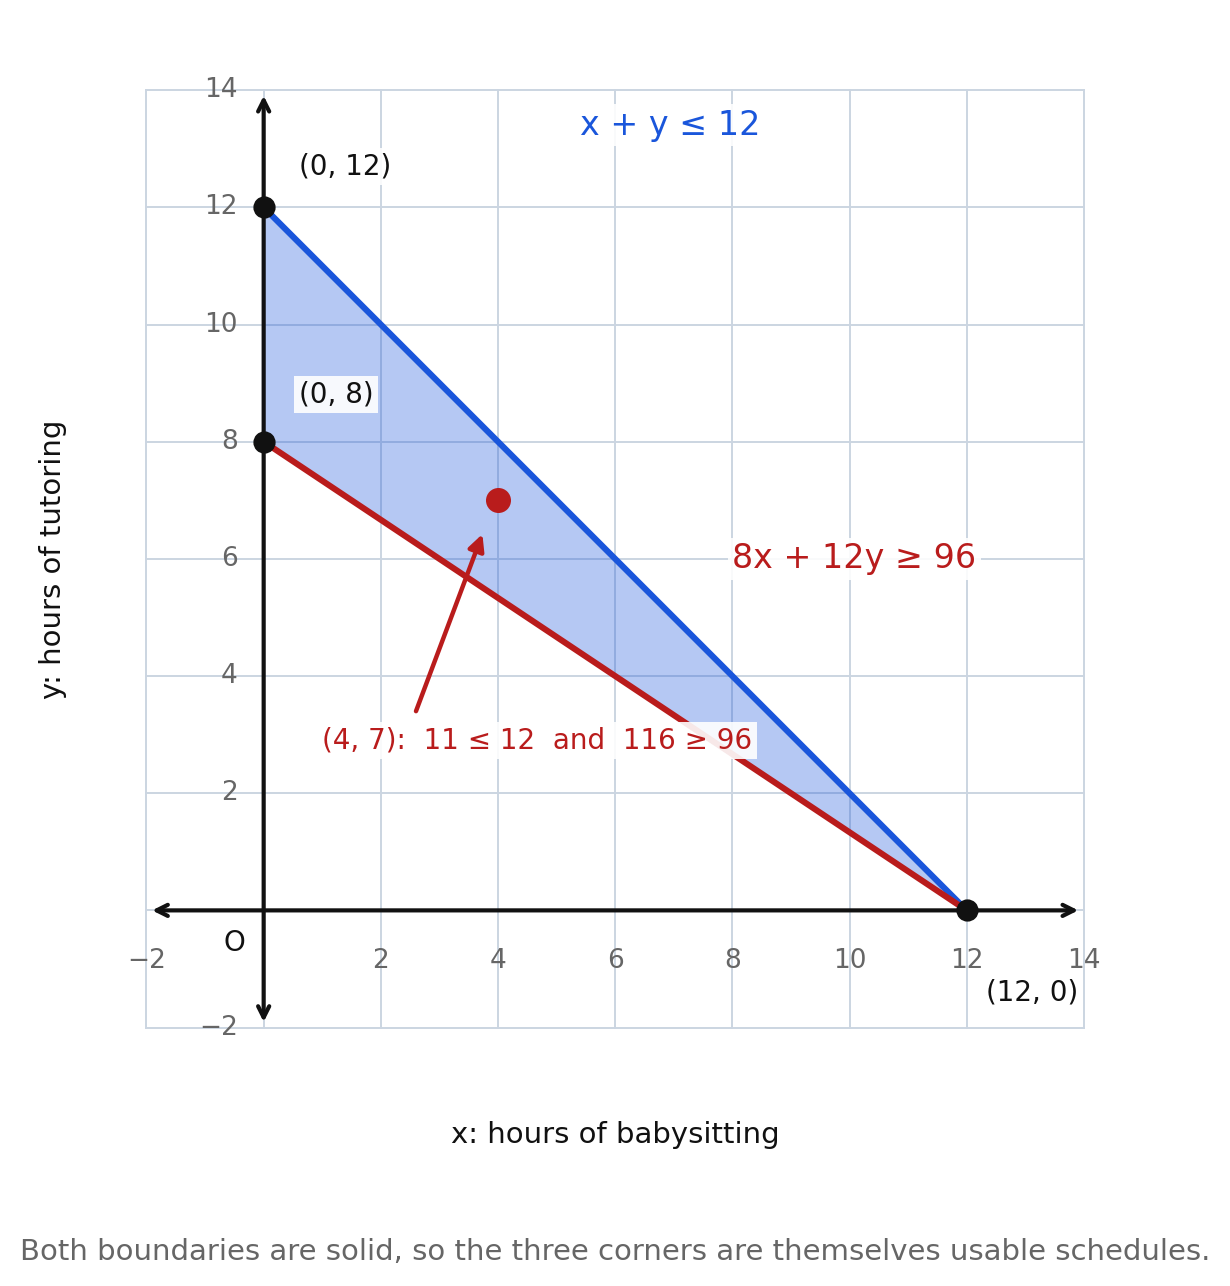
The solution set is a triangle, and every point of it is a workable week. Its three corners are , , and :
- — twelve hours of tutoring and no babysitting, earning , using the whole hour budget.
- — eight hours of tutoring and no babysitting, earning exactly , the least work that reaches the goal.
- — twelve hours of babysitting and no tutoring, earning exactly in exactly hours. Both boundaries pass through this point, so it is the tightest schedule of the three.
Both boundaries are solid here, because "at most" and "at least" both admit equality, so all three corners are usable schedules.
The two special cases
Two half planes do not always overlap in a region with a corner.
- Parallel boundaries. The system and has boundaries with the same slope, so they never meet. The solution set is an infinite strip between them, with no corner at all.
- No solutions. The system and asks for points above one line and below a lower parallel line. Nothing satisfies both, so the solution set is empty — and the picture shows two shadings that never touch. This is the two-variable cousin of the no-solution case for systems of equations in Chapter 8.
Worked examples
Example 1 — Graph a system
Graph and , and give the corner.
Graph solid with the region above shaded, and dashed with the region below shaded; the origin passes both, since and . The boundaries meet where , so and , giving .
Answer: The solution set is the wedge containing the origin, and the corner is . It is excluded, because is false.
Example 2 — Deciding membership
Is a solution of and ?
First: , true. Second: , true.
Answer: Yes — both are true, so the pair is a solution of the system.
Example 3 — One out of two
Is a solution of that same system?
First: is false. There is no need to check the second.
Answer: No. A single failure is enough to disqualify a point.
Example 4 — Creating a system
Write a system for: a student spends at most on movie tickets at each and snacks at each, and buys at least movie tickets.
Let be the number of movie tickets bought and the number of snacks bought.
Answer: and , with . Both boundaries are solid.
Example 5 — A system with no solutions
Describe the solution set of and .
The boundaries are parallel, both with slope , and the second sits two units below the first. The first region is above the higher line; the second is below the lower one.
Answer: There are no solutions. The two shadings never overlap, so the solution set is empty.
Guided practice
- Use the figure showing two overlapping half planes. Name the two inequalities and describe, in words, where their solution sets overlap.
- In that same figure, verify that is a solution by substituting into both inequalities.
- Use the figure showing the overlap alone. Give the corner, show the algebra that locates it, and say whether the corner is itself a solution.
- In that same figure, decide whether is a solution, and name which inequality it fails.
- Graph the system and , and describe the resulting region in words.
- Use the contextual system figure. Write the two inequalities and define both variables in full sentences with units.
Independent practice
- Graph each system and shade its solution set. State the corner if there is one. a) and b) and c) and d) and
- Find the corner of the system in item 63a algebraically, and decide whether it belongs to the solution set. Explain how the boundary styles decide that.
- Reasoning. Explain why the solution set of a system is the overlap of the two shadings and not everything either shading covers.
- Write a system of two linear inequalities that has no solutions, and explain how its graph shows that.
- Decide whether each pair is a solution of and , showing both substitutions. a) b) c) d)
- Application. Use the contextual system figure. Decide whether five hours of babysitting and five hours of tutoring is a workable week, showing both substitutions and the dollars earned.
- Application. For that same system, name a schedule that meets the hour limit but misses the earnings goal, and show the arithmetic that proves it misses.
- Error analysis. A student says that any point lying in either shaded region is a solution of a system. Use the point and the system , to show why that is wrong.
- Application. Write a system for: a student may work at most hours next week, must earn at least , and is paid an hour babysitting and an hour tutoring. Define both variables and state the two restrictions the situation adds.
- Application. For the system in item 71, give the three corners of the feasible region, and interpret one of them in a sentence with units.
Exit ticket 9.4
- Graph the system and , and give the corner.
- Decide whether is a solution of the system in item 73, showing both substitutions.
- Explain how the graph of a system of two linear inequalities differs from the graph of a system of two linear equations from Chapter 8.
- Application. Write a system for: a student spends at most on movie tickets at each and snacks at each, and buys at least movie tickets.
Lesson 9.5 — Verifying and Interpreting Solutions
Three checks, and what each one catches
A.EI.2h asks for verification algebraically, graphically, and with technology, and it asks for the solution method to be explained and the answer interpreted in context. The three checks are not three ways of doing the same thing. Each catches a different kind of mistake.
| Check | How you do it | What it catches |
|---|---|---|
| Algebraic | substitute the pair into every inequality and read true or false | arithmetic slips, and the strict-versus-inclusive question at a boundary point |
| Graphical | locate the point on your graph and see whether it is in the shaded region | a boundary drawn correctly but shaded on the wrong side, or a missed reversal |
| Technology | enter the inequalities into a graphing tool and compare its shading with yours | an error you made consistently in both of the first two checks |
Notice what the algebraic check cannot do. Substituting one point and getting true proves that that point is a solution. It does not prove your shading is right — a region shaded on the wrong side still contains points you can test successfully, if you test the wrong ones. The graphical check is what audits the region.
And notice what the graphical check cannot do. A picture is drawn to about a tenth of a grid square; it cannot tell you whether a point exactly on a boundary is included. Only substitution answers that.
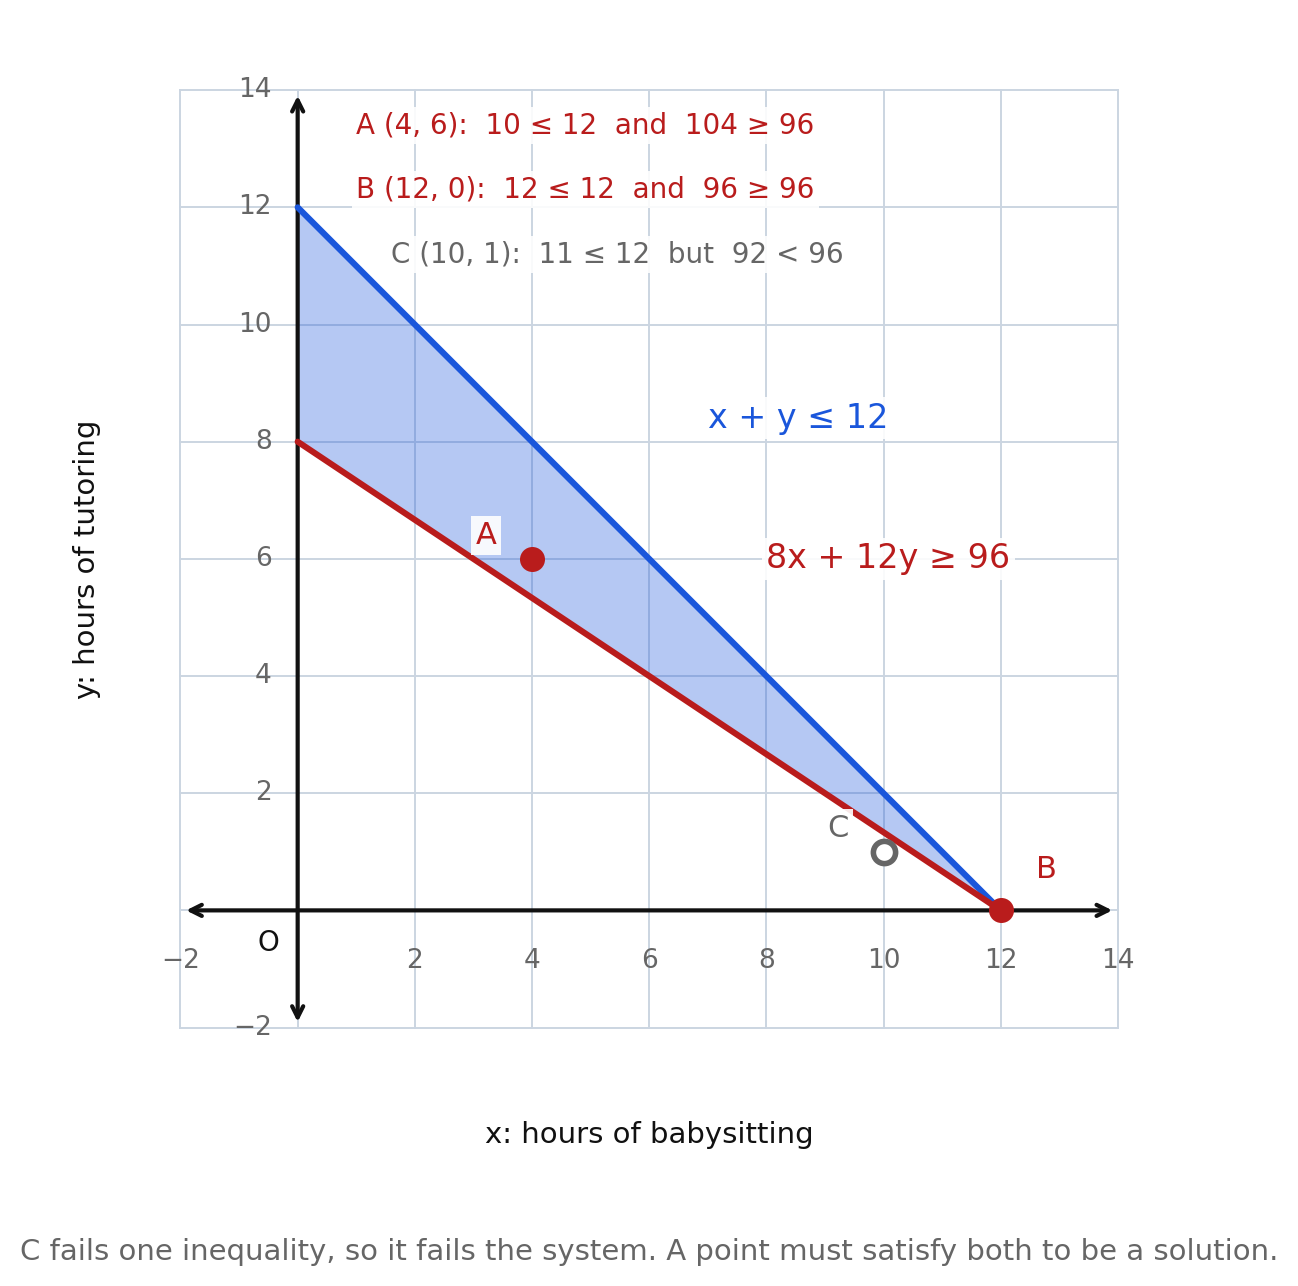
Three candidates for the work-schedule system , :
- A . Hours: , and is true. Earnings: , and is true. A solution. Graphically, A sits inside the shaded triangle. In context: four hours of babysitting and six of tutoring is hours of work for .
- B . Hours: , true. Earnings: , and , true. A solution, and it lies on both boundaries at once — the corner. Both symbols are inclusive, so it counts. In context: the full twelve hours, all babysitting, earning exactly the target.
- C . Hours: , true. Earnings: , and is false. Not a solution. Graphically, C sits just below the earnings boundary, outside the triangle. In context: that week is short enough but earns too little.
C is the case worth dwelling on. It passes one test and fails the other, and only checking both catches it.
Using technology as a check
A graphing tool — the Desmos Virginia Graphing Calculator is available for the entire End-of-Course test, and this course is not calculator-free — will shade an inequality directly.
- Type the inequality as written, using
<=for and>=for : entery <= -x + 5, then on a second liney > 2x - 4. - Read the overlap. Two shadings appear, and the region covered twice is the solution set of the system.
- Compare with your own graph. Same boundaries, same styles, same overlap?
- Plot the candidate point and see it land inside or outside.
When the tool disagrees with you, that disagreement is information, not a verdict. Work through the possibilities in order.
- Did you mistype the inequality? Check the symbol and every sign.
- Did you miss a reversal when solving for ? This is the most common cause of a region that is shaded on exactly the wrong side, and it is easy to confirm: test the origin in the original inequality, which needs no solving at all.
- Did you use the wrong line style? Compare the symbol with the boundary you drew.
Only after checking those three should you conclude anything about which picture is right.
Explaining a method
A.EI.2h asks you to explain the solution method, which means writing sentences a classmate could follow. A complete explanation of graphing sounds like this:
I solved for . Subtracting gave , and dividing both sides by reversed the symbol, so . I drew the boundary through and , dashed, because the original symbol is strict and boundary points are not solutions. To pick a side I tested in the original inequality: , and is false, so the origin is not a solution and I shaded the side away from it, below the line. I confirmed with the shaded point : , and is true.
Every claim in that paragraph is checkable, which is what makes it an explanation rather than a description.
Interpreting a solution
Interpreting means saying what a pair means about the situation, in a sentence, with units.
- An interior point is a plan with room to spare. works, and it works with two hours and eight dollars of slack.
- A boundary point is a plan that uses a limit exactly. earns precisely the required in precisely the hours allowed.
- A corner is where two limits bind at once, which is why corners are the points people actually ask about: they are the most extreme plans that still work.
- A point outside is a plan that fails, and the useful interpretation names which requirement it fails and by how much. earns , missing the goal by .
Worked examples
Example 1 — Verify a pair in one inequality
Verify that satisfies , algebraically and graphically.
Algebraically: , and is true. Graphically: the point lies exactly on the boundary , which is drawn solid.
Answer: It is a solution, and it is a boundary solution — the inclusive symbol is what admits it.
Example 2 — Verify a pair in a system
Verify in the system , .
First: , true. Second: , true.
Answer: A solution of the system; both checks pass, and graphically the point lies where the two shadings overlap.
Example 3 — A failure worth naming
Verify in that same system.
First: , true. Second: , false.
Answer: Not a solution. It satisfies the first inequality only, so it lies in one shading but outside the overlap.
Example 4 — A technology disagreement
You graph by hand and shade below the boundary, but the graphing tool shades above it. What do you check?
Solving for : , and dividing by reverses the symbol, giving — the region above.
Answer: The reversal was missed by hand. Testing in the original confirms the tool: , and is true, so the origin is a solution, and the origin lies above the boundary, since .
Example 5 — Interpreting in context
For the work-schedule system, interpret .
Hours: , true. Earnings: , true.
Answer: Three hours of babysitting and eight hours of tutoring is a workable week: hours of work, one hour under the limit, earning , which is more than the goal.
Guided practice
- Use the verification figure. Verify candidate A, , algebraically in both inequalities, and say where it sits on the graph.
- In that same figure, verify candidate B, , and explain what it means that this point lies on both boundaries at once.
- In that same figure, explain why candidate C, , is not a solution, naming the inequality it fails and by how much.
- Verify in the system and , algebraically, and describe how the graph confirms it.
- Describe how you would check the system , with a graphing tool, and say what you would do first if the tool's shading disagreed with yours.
- Interpret candidate A of the verification figure in a sentence about the student's week, with units.
Independent practice
- Decide whether each pair satisfies , showing the substitution, and say which pairs lie on the boundary. a) b) c) d)
- Decide whether each pair is a solution of the system and , showing both substitutions. a) b) c)
- Technology. Describe, step by step, how to enter the system and into a graphing tool, how to read the solution set from what appears, and how to test a candidate point with the same tool.
- Application. For the work-schedule system, verify algebraically in both inequalities, then interpret it in a sentence with units, naming the dollars earned.
- Reasoning. Explain why one successful substitution proves that a point is a solution but does not prove that your shading is correct. Say which check does audit the shading.
- Error analysis. A student graphs by hand, shades below the boundary, and finds that a graphing tool shades above it. Identify the likely error, show the algebra that settles it, and name the one-line test that would have caught it.
- Confirm that the corner of the system , satisfies both boundary equations, then decide whether the corner is a solution of the system.
- Application. Interpret the corner of the work-schedule system in one sentence with units, and say what makes a corner worth asking about.
- Explain the method. Write a paragraph explaining to a classmate how to graph , naming the reversal, the line style, the test point, and the confirming substitution.
- Application. For the fair-budget inequality , verify algebraically and interpret the result in a sentence about the money spent.
Exit ticket 9.5
- Verify in the system and , showing both substitutions.
- Verify in that same system, and name the inequality it fails.
- Describe the three ways A.EI.2h asks you to verify a solution, and say what each one catches that the others do not.
- Application. Give one solution of , where is hours tutoring at an hour and is hours at a shop paying an hour, and interpret it in a sentence with units.
Chapter 9 Review
Vocabulary. linear inequality in two variables · ordered pair · solution set · half plane · boundary · strict · inclusive · dashed boundary · solid boundary · test point · system of two linear inequalities · overlap · corner · feasible region · first-quadrant restriction · verify · interpret
A.EI.2 d through h ask four different kinds of question, so this review is organized by bullet. Part A graphs one inequality (bullet e), Part B creates inequalities from situations (bullet d), Part C builds and graphs systems (bullets f and g), and Part D verifies and interprets (bullet h).
Part A — Graphing one linear inequality
- Graph . State the boundary, the line style, the test point, and the shaded side.
- Graph . Show the step that reverses the symbol, and confirm the shading by testing in the original inequality.
- Graph . Describe the boundary and the shaded region.
- A graph has a solid boundary through and , with the region containing the origin shaded. Write the inequality, and confirm it with a substitution.
- Use the figure comparing a dashed boundary with a solid one. Explain, using the point , what the two line styles mean.
- Error analysis. A student rewrites as and shades above the boundary. Identify the error, and use in the original inequality to show that the shading is wrong.
Part B — Creating an inequality from a situation
- Application. A truck can carry at most pounds. Crates weigh pounds each and bags weigh pounds each. Write the inequality and define both variables in full sentences with units.
- Application. For the truck of the previous item, decide whether crates and bags can be loaded, showing the arithmetic, and say what your answer means.
- Application. Use the fair-budget figure. Interpret both intercepts of the boundary and one interior point, each in a sentence with units.
- Explain why a contextual model is usually restricted to the first quadrant, and describe what that restriction does to the shaded region.
- Application. A fundraiser sells tickets at and sponsorships at and must raise more than . Write the inequality, define both variables, and say whether the boundary is dashed or solid.
- Reasoning. Explain the difference between "at least " and "more than " in choosing both the symbol and the boundary style, and name one amount the two models disagree about.
Part C — Systems of two linear inequalities
- Graph the system and , and give the corner.
- Decide whether is a solution of the system in the previous item, showing both substitutions.
- Use the figure showing the overlap of two half planes with its corner. Name the system, give the corner, and say whether the corner is a solution.
- Application. Use the contextual system figure. Write the system, define both variables, name the three corners of the feasible region, and interpret the corner .
- Write a system of two linear inequalities with no solutions, and explain how its graph shows that.
- Reasoning. Explain why the solution set of a system of two linear inequalities is usually a region with corners, while the solution of a system of two linear equations in Chapter 8 is usually a single point.
Part D — Verifying and interpreting
- Application. Verify in the work-schedule system , , showing both substitutions, and interpret the result in a sentence with units.
- Verify in the system and algebraically, and describe how a graph would confirm your answer.
- Technology. Describe how you would confirm your graph of with a graphing tool, and name the specific error a disagreement would most likely be pointing at.
- Application. For the fair-budget inequality , list every whole number of ride bands that can be bought alongside exactly game passes, and interpret the list in a sentence.
Standards coverage check — Chapter 9
| Knowledge and Skill | Where it is taught | Where it is practiced | Where it is applied or interpreted in context |
|---|---|---|---|
| A.EI.2d — create a linear inequality in two variables to represent a contextual situation | 9.3 (define the variables, build the expressions, choose the symbol from the phrase; the first-quadrant restriction) | 42, 43, 44, 45, 50, 51, 53, 54, 55; 107, 108 | 46, 47, 48, 49, 52, 56; 103, 104, 105, 106, 118 |
| A.EI.2e — represent the solution of a linear inequality in two variables graphically on a coordinate plane | 9.1 (a solution is a pair; the boundary; dashed versus solid); 9.2 (the four steps, the test point, the reversal, one-variable boundaries) | 1–18, 19–33, 35–38; 97, 98, 99, 100, 101, 102 | 13, 34; 105 |
| A.EI.2f — create a system of two linear inequalities in two variables to represent a contextual situation | 9.4 (two limits pulling in opposite directions; both restrictions stated) | 62, 66, 71, 76; 113 | 68, 69, 71, 72; 112 |
| A.EI.2g — represent the solution set of a system of two linear inequalities graphically on a coordinate plane | 9.4 (shade each, keep the overlap; the corner from the two boundary equations; parallel and empty cases) | 57–67, 70, 73, 74, 75; 109, 110, 111, 114 | 68, 69, 72; 112 |
| A.EI.2h — verify possible solutions algebraically, graphically, and with technology; explain the method and interpret solutions in context | 9.5 (what each of the three checks catches; disagreement as information; explaining a method; interpreting interior, boundary, and corner points) | 77–81, 83, 84, 85, 87, 88, 89, 91, 93, 94, 95; 116, 117 | 82, 86, 90, 92, 96; 115, 118 |
Where each verification mode is exercised. Algebraically — every substitution item, including 5–8, 13–16, 67, 83, 84, 89, 93, 94, 115, 116. Graphically — 3, 4, 9, 19, 20, 23, 24, 57–60, 77–79, 101, 111. With technology — 81, 85, 88, 117, and the disagreement protocol taught in Lesson 9.5.
Boundaries respected. Every system in this chapter has exactly two inequalities, and every inequality has exactly two variables, as A.EI.2 d through g require. No item asks a student to solve a system of two linear equations by substitution or elimination, or to classify a system of equations as having one, none, or infinitely many solutions; those are A.EI.2 a, b, and c, in Chapter 8, and they appear here only as the algebra that locates a corner (items 59, 64, 89, 109). No item asks for a linear inequality in one variable graphed on a number line; that is A.EI.1c, in Chapter 3, and it appears here only as the contrast drawn in Lesson 9.1. No item asks the student to write the equation of a line from two points or from a point and a slope, which is Chapter 6. Nothing in this chapter is presented as calculator-free.
Answer keys for every item in this chapter are in Appendix A.