Chapter 7 — Graphing and Evaluating Linear Functions
Standard: A.F.1 (f, g, h)
A.F.1 — verbatim. The student will investigate, analyze, and compare linear functions algebraically and graphically, and model linear relationships. Students will demonstrate the following Knowledge and Skills: f) Graph a linear function in two variables, with and without the use of technology, including those that can represent contextual situations. g) For any value, , in the domain of , determine , and determine given any value in the range of , given an algebraic or graphical representation of a linear function. h) Compare and contrast the characteristics of linear functions represented algebraically, graphically, in tables, and in contextual situations.
By the end of this chapter you will be able to:
- Graph a linear function by hand from slope-intercept form, by plotting the -intercept and stepping off the slope in either direction (A.F.1f)
- Graph a linear function by hand from its two intercepts, and from a table of inputs you choose on purpose (A.F.1f)
- Graph a horizontal line and a vertical line without stepping off any slope (A.F.1f)
- Graph a contextual linear function on axes whose two scales differ, and say what one cell on each axis is worth (A.F.1f)
- Graph a linear function with technology, choose a viewing window from what you already know about the function, and use the table feature (A.F.1f)
- Given , determine — from the equation and from the graph (A.F.1g)
- Given , recover the that produced it — from the equation and from the graph (A.F.1g)
- Compare and contrast two linear functions presented in any of four ways — algebraically, graphically, in a table, or in a context — and say which representation answers which question fastest (A.F.1h)
Lessons: 7.1 Graphing by Hand from Slope-Intercept Form · 7.2 Intercepts, Tables, and the Two Special Lines · 7.3 Graphing with Technology · 7.4 Determining , and Recovering · 7.5 Comparing the Four Representations
Why this chapter matters. Chapter 5 read a linear function, and Chapter 6 wrote one. This chapter makes one usable. A model nobody can draw and nobody can query is just an ornament: the two questions people actually bring to a linear model are "what will it be at this input?" and "what input gets me to this output?", and both of them are in bullet g. Bullet f gives you the picture that answers them at a glance, by hand when you have paper and with technology when the numbers are ugly. Bullet h then steps back and asks the question that closes out the whole linear sequence: given the same relationship written four different ways, what does each way show you that the others hide?
Scope note. This chapter draws and queries linear functions. Identifying and interpreting domain, range, zeros, slope, and intercepts, and converting among slope-intercept, standard, and point-slope form, are A.F.1 a, b, and c, in Chapter 5; this chapter uses all of them constantly and says so when it does. Writing the equation of a line — from a graph, from two points, from a slope and a point, and parallel or perpendicular to a given line — is A.F.1 d and e, in Chapter 6; when this chapter hands you an equation, that equation is a given, not something to be derived. Bullet h is taught here rather than earlier because it is the capstone of the linear sequence: comparing across representations is only possible once you can produce all four of them, and Chapter 5, Chapter 6, and Lessons 7.1 through 7.4 are what make that true. Systems of two linear equations are Chapter 8, so when Lesson 7.5 compares two models on one grid it reads the crossing point off the picture and confirms it by solving a one-variable equation, the way Chapter 2 taught.
Conventions this chapter fixes.
- A graph drawn on a bare grid gets arrowheads on both ends unless a context restricts the domain, in which case it is a segment with its endpoints marked, exactly as in Chapter 5.
- Slope is a fraction, always. An integer slope is read as before stepping, because the denominator is the run and there has to be one.
- Notation for the two directions of bullet g. "Find " means substitute and simplify. "Find when " means set the rule equal to and solve. Both name the same point on the graph from opposite ends.
- A viewing window is reported as the four numbers a calculator asks for: the smallest and largest , and the smallest and largest , together with the scale — what one tick or one cell is worth on each axis.
- Technology is an instrument of verification, not a shortcut. Algebra 1 has no no-calculator standards, and the Desmos Virginia Graphing Calculator is available for the entire End-of-Course test. This volume therefore asks for the algebraic result and its graphical confirmation. When the two disagree, that is information: one of them is wrong, and you are not finished until you know which.
- A calculator reports decimals; a zero may be exact. If the screen says and the algebra says , the exact answer is and the screen is rounding.
- Item numbering runs straight through the chapter, from 1 in Lesson 7.1 to 120 at the end of the review. It does not restart at each lesson.
Lesson 7.1 — Graphing by Hand from Slope-Intercept Form
Why "without technology" is a real skill
A.F.1f asks for graphing with and without the use of technology, and it names them in that order for a reason: the by-hand method is not a fallback for when the batteries die. It is how you know what the screen should look like before you look at it. A student who can step off a slope knows, without pressing anything, that is steep and crosses the -axis far below the origin — and so is not surprised when the standard window shows almost nothing.
The by-hand method takes a function in slope-intercept form , the form Chapter 5 named and Chapter 6 reported every answer in.
The procedure
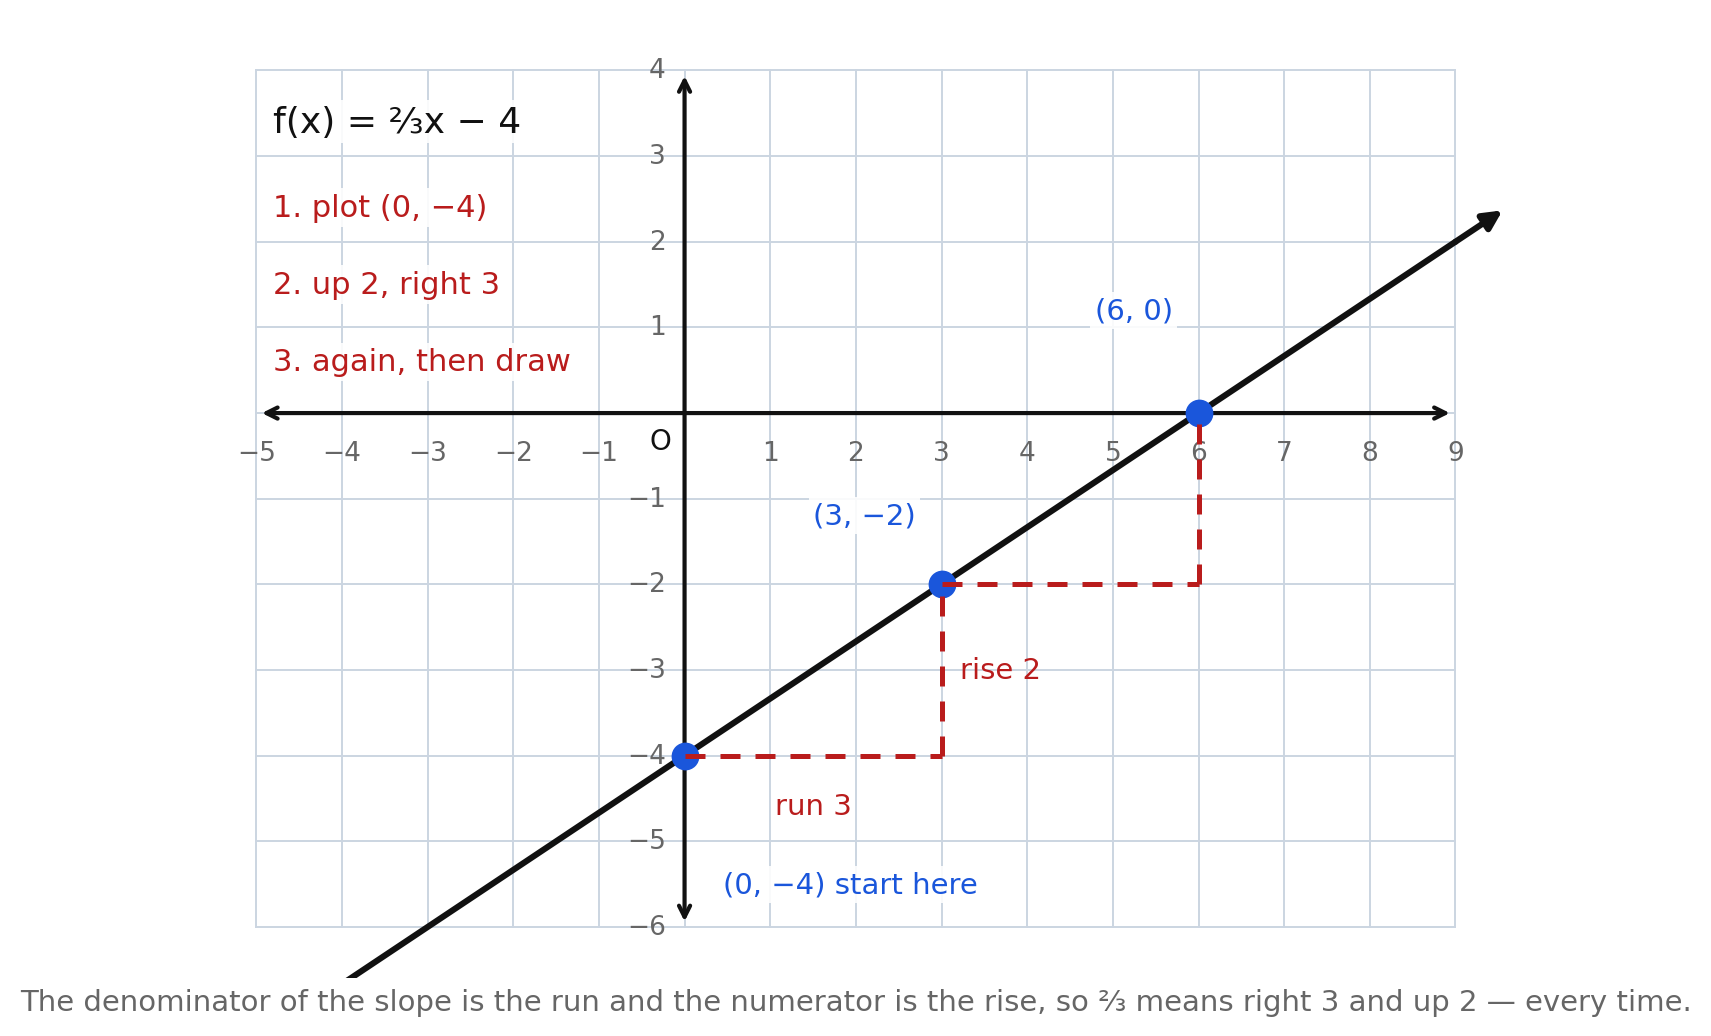
- Plot the -intercept. It is , and it is free — no arithmetic at all.
- Write the slope as a fraction. The denominator is the run, the numerator is the rise.
- Step off the slope from the point you just plotted, and put a dot where you land.
- Step again to get a third point. Two points determine a line; the third one catches an error before you draw.
- Draw the line through your points, past all of them, with an arrowhead on each end.
The figure works all the way through. The -intercept is . The slope means right 3, up 2, which lands on ; stepping again lands on .
Check the third point against the rule, which is the whole point of plotting it:
Notice that is the -intercept, so a graph built this way often hands you the zero for free.
Stepping in either direction
A slope can be walked backwards. If takes you right and up, then reversing both signs takes you left and down, and you stay on the same line.
That matters most for a negative slope, where the two directions look completely different on the page.
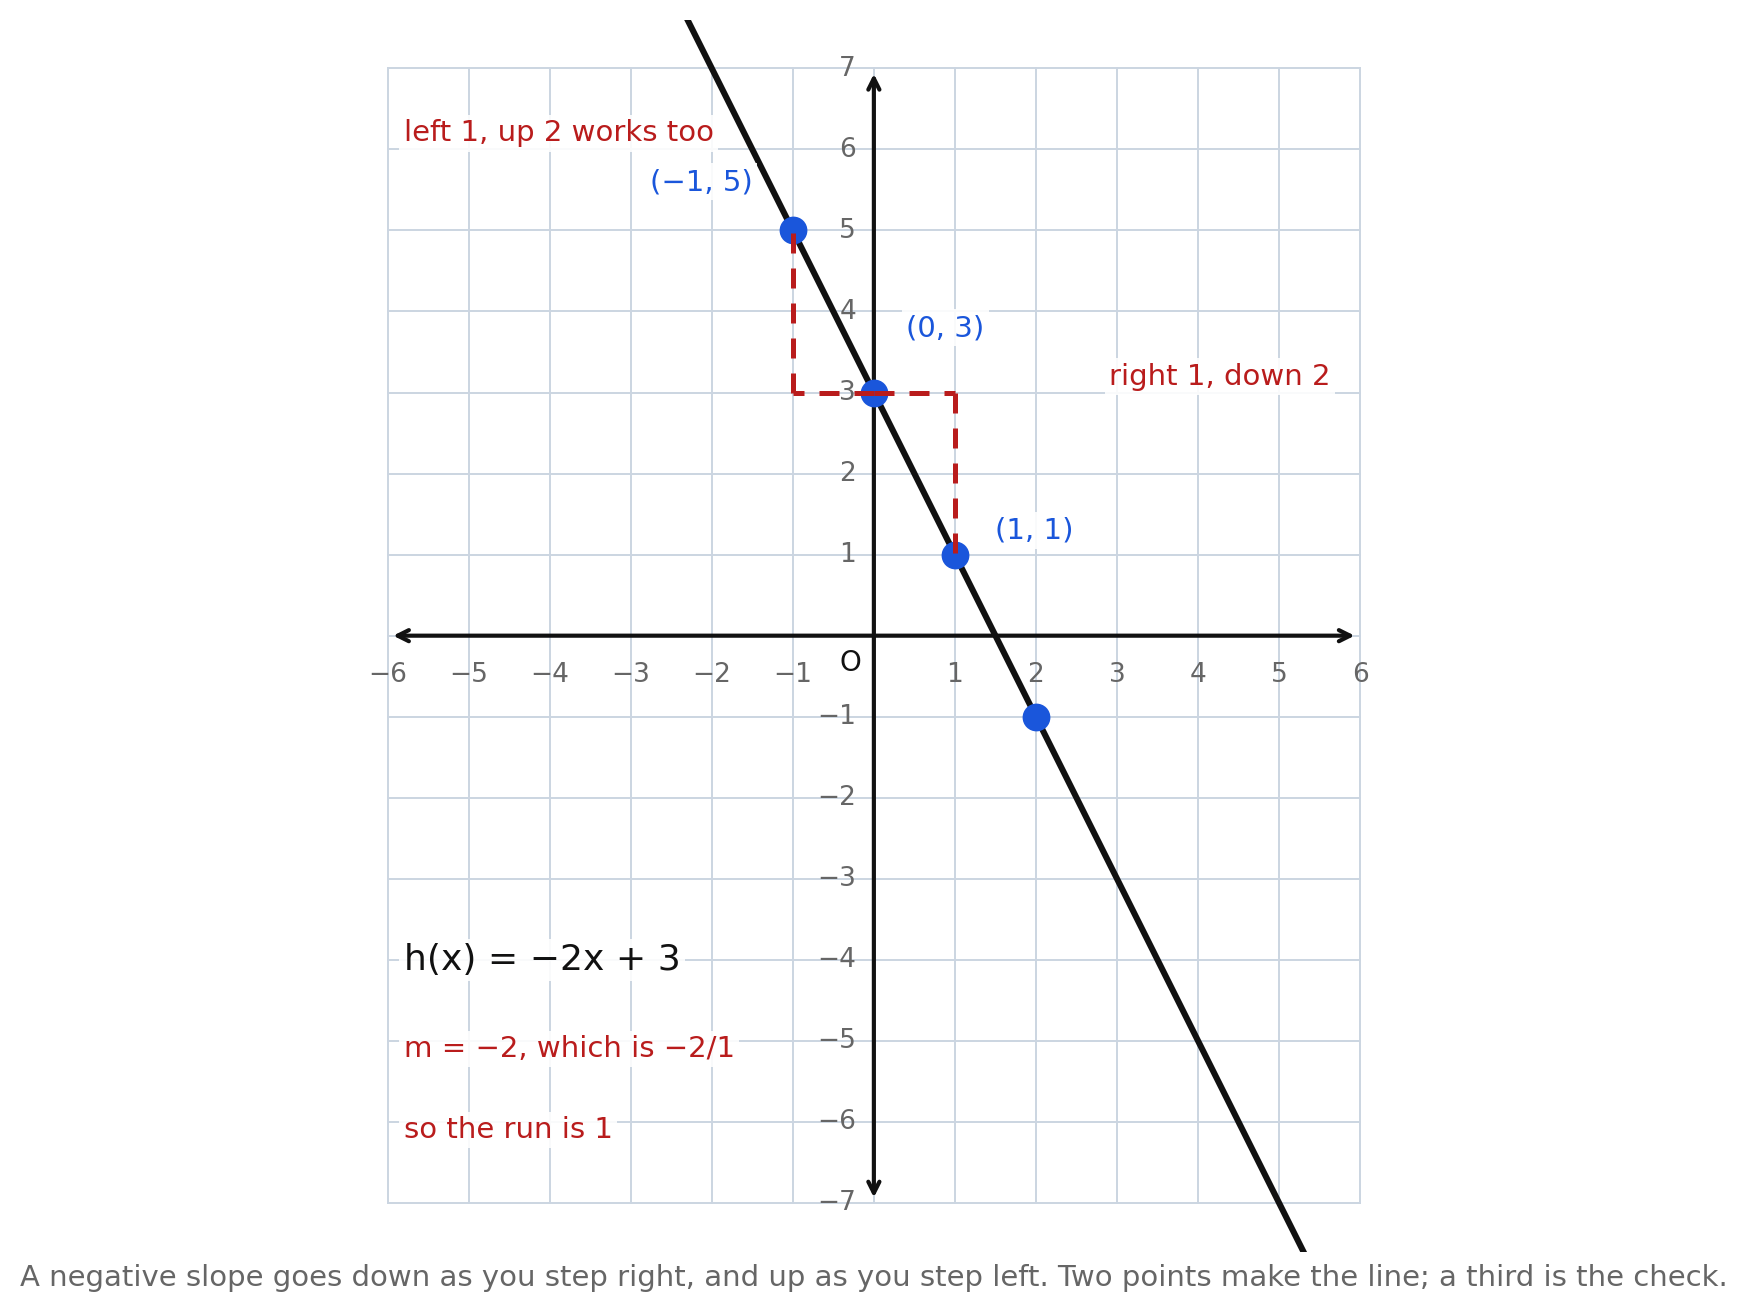
The figure shows . Its slope is the integer , so write it as a fraction first:
The run is and the rise is : right 1, down 2, from to to .
Reversing both gives a run of and a rise of : left 1, up 2, from to . Substituting confirms it: .
Two habits fall out of this.
- Put the negative sign on the rise, not the run. Writing as is legal but invites a sign error; says "down 2" out loud.
- Step both ways when the intercept is near an edge. If on a grid that stops at , you cannot step down. Step up and left instead.
Where students lose points
- Stepping the fraction upside down. For , the run is , not . The denominator is always the horizontal move. If you find yourself going up and right , you have graphed instead.
- Forgetting that is a -coordinate. The first point of is , on the -axis. It is not , and it is certainly not .
- Drawing a segment when the function has no restriction. With no context, the domain is all real numbers, so the ink gets arrowheads.
Worked examples
Example 1 — An integer slope
Graph by hand. Name the first point and two more.
The -intercept is . The slope means right 1, up 3.
Answer: Plot ; step to and ; draw with arrowheads.
Example 2 — A fractional slope
Graph . Name the first point and two more.
The -intercept is , and means right 5, up 3.
Answer: , then , then . Going the other way, is also on the line and fits on a smaller grid.
Example 3 — A negative slope, stepped both ways
Graph . Give one point on each side of the -intercept.
The -intercept is and .
Answer: Right 1, down 1 gives . Left 1, up 1 gives .
Example 4 — Choosing the direction to fit the grid
The grid runs from to on both axes. Graph .
Stepping right 4 and up 1 from lands on , still on the grid, but a second step leaves the top.
Answer: Plot , step right to , and step left to and — the left-hand steps stay inside the window far longer.
Example 5 — Catching an error with the third point
A student graphs and plots , , and . Is anything wrong?
Check the third point in the rule: , not .
Answer: The third point should be . The student stepped up instead of on the second step — exactly the mistake a third point exists to catch.
Guided practice
- Use the figure of . Name the point plotted first, the slope, and the two other points the steps produce.
- In that same figure, what do "up 2" and "right 3" refer to, and which one is the denominator of the slope?
- In that same figure, verify algebraically, and say which intercept that point is.
- Use the figure of . Write the slope as a fraction and state the step it names.
- In that same figure, what point does "left 1, up 2" produce? Verify it by substitution.
- Graph by hand. Give the first point plotted and two more points.
Independent practice
- For each function, give the point you plot first and the step you take. a) b) c) d)
- Graph on Grid A. List three points with integer coordinates.
- Graph on Grid B. List three points with integer coordinates.
- Error analysis. A student graphs by plotting and then going up and right . Identify the error, name the function that student actually graphed, and give the correct step.
- List four points with integer coordinates on , using inputs on both sides of the -axis.
- Reasoning. Explain why stepping left and up by the reversed slope lands on the same line as stepping right and down. Use in your explanation.
- Application. An office printer starts a shift with sheets of paper and uses sheets per job, so . Name the point you would plot first and the step you would take, then explain why a grid of one sheet per cell is a bad choice.
- Graph and by hand on the same grid. Name the first point of each, and say what is the same about the two graphs and what is different.
- Application. A phone battery falls from full according to percent after hours. Give the first point and the step, and find how far right you must travel before the graph reaches .
- Error analysis. A student says the first point of is , "because comes first." Identify the error and give the correct first point and step.
Exit ticket 7.1
- Give the first point plotted and the step for .
- List three points with integer coordinates on .
- Explain why two points are enough to draw a line, and why plotting a third is still worth the time.
- Graph by hand. Give the -intercept and two more points.
Lesson 7.2 — Intercepts, Tables, and the Two Special Lines
Three by-hand methods, not one
Slope stepping is the default, but it is not always the cheapest route. Two other by-hand methods are faster in the situations they suit, and two lines need no method at all.
| The function looks like | Fastest by-hand method |
|---|---|
| plot , step off the slope | |
| (standard form) | find both intercepts |
| a fractional slope, or no form at all | build a table of chosen inputs |
| or | plot the constant and rule a straight line |
Graphing from the two intercepts
Chapter 5 showed that standard form makes both intercepts nearly free, because setting one variable to zero deletes a whole term. Two points are all a line needs, so that is a complete graphing method.
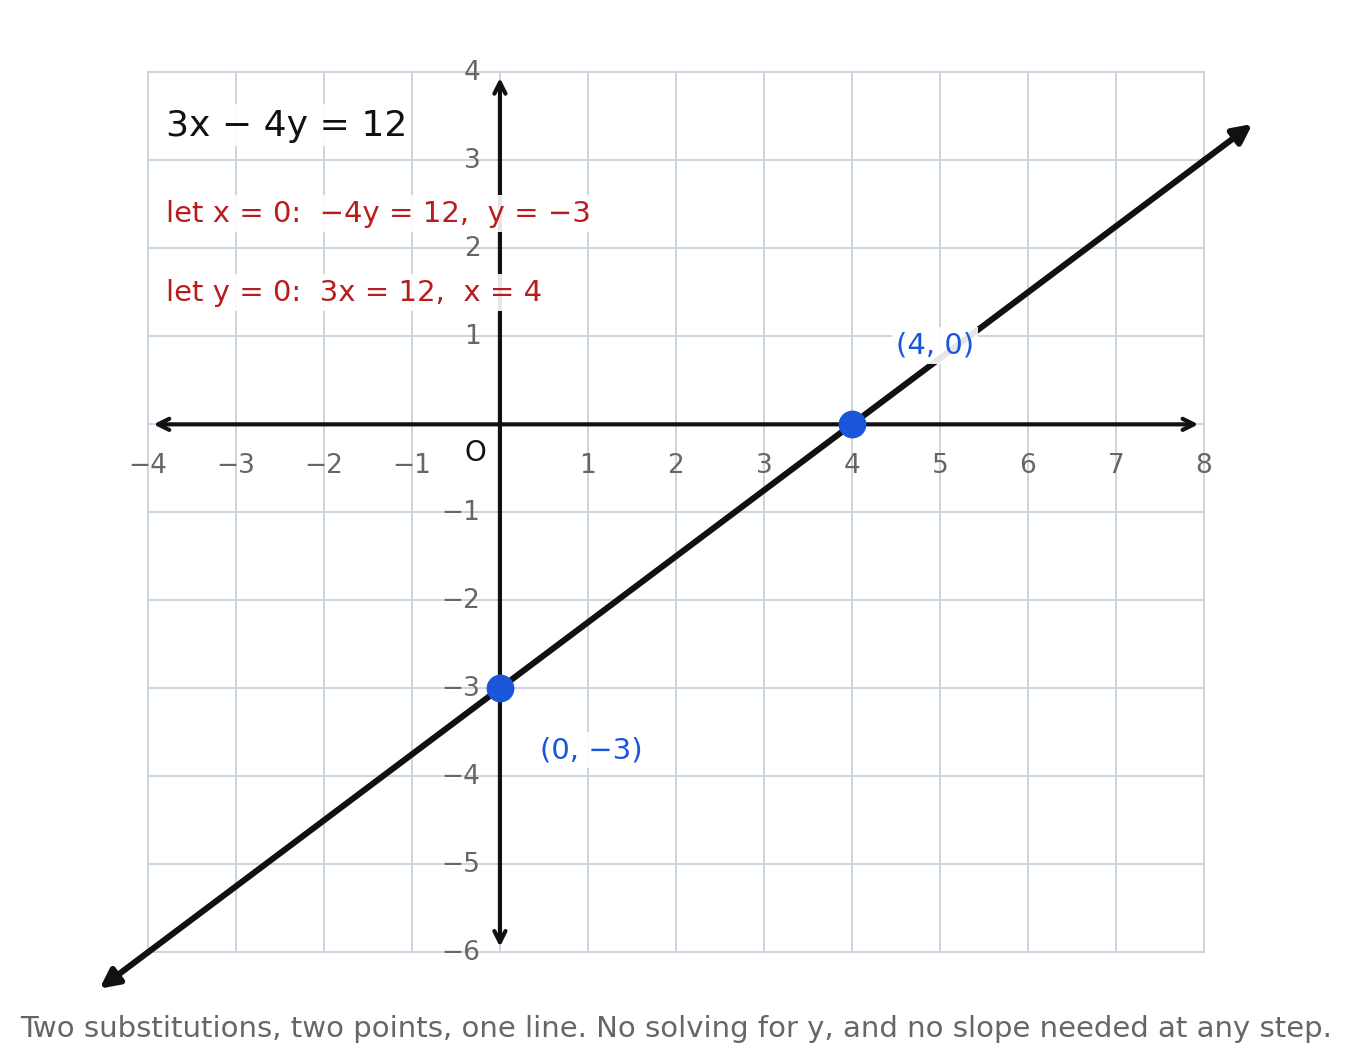
For :
- Let . Then , so . Plot .
- Let . Then , so . Plot .
- Draw the line through the two points, with arrowheads.
No solving for , no slope, no fractions along the way. (If you want the slope anyway, converting gives , and the graph confirms a rise of over a run of between the two plotted points.)
The method has one blind spot worth naming: a line through the origin has only one intercept, because both are the same point . For you must find a second point some other way — substitute any convenient input.
Graphing from a table you choose
A table is the most general method, and its whole art is in choosing the inputs.
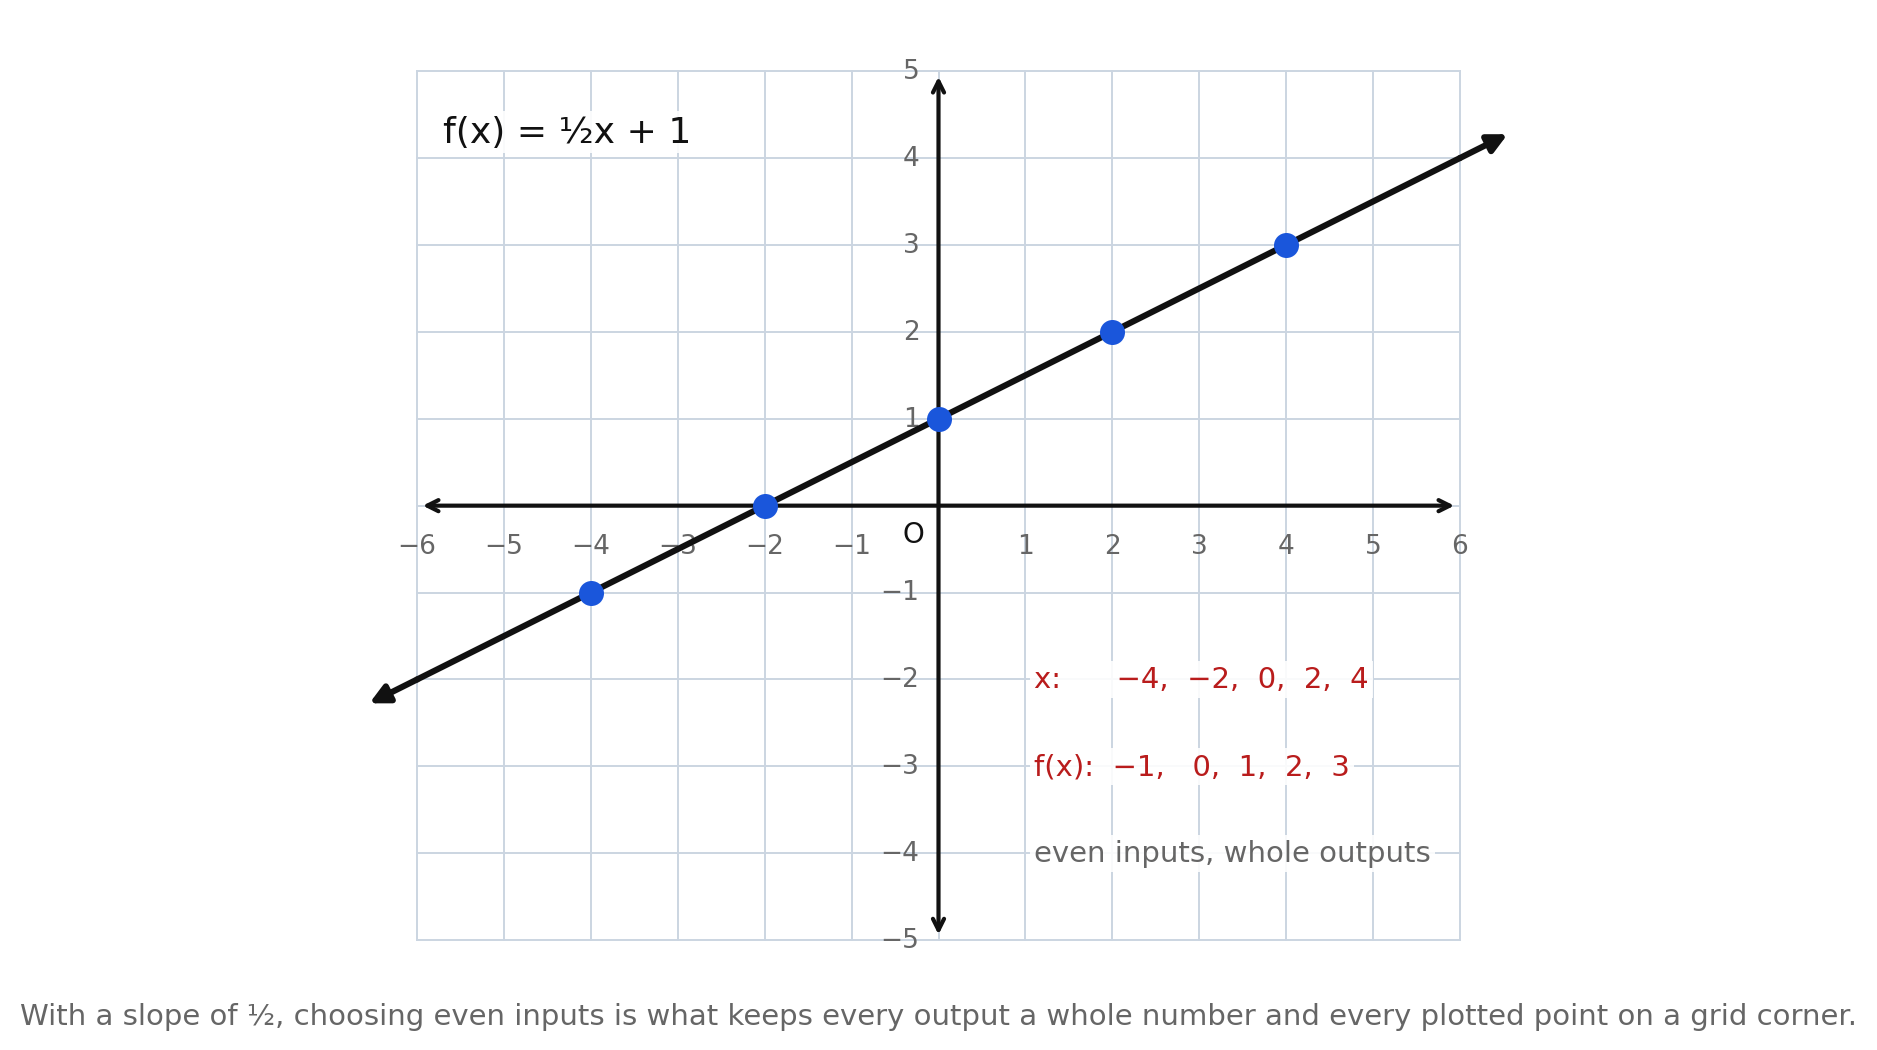
The figure graphs from a table:
Every output is a whole number, so every point lands exactly on a grid corner. That did not happen by luck. Choosing would have produced , , — points you have to eyeball between gridlines, which is how a hand-drawn line ends up crooked.
The rule for choosing inputs. Pick inputs that are multiples of the denominator of the slope. For a slope of , use even numbers; for , use multiples of ; for , use multiples of . And always include if you can, because it hands you the -intercept.
The two lines that need no stepping
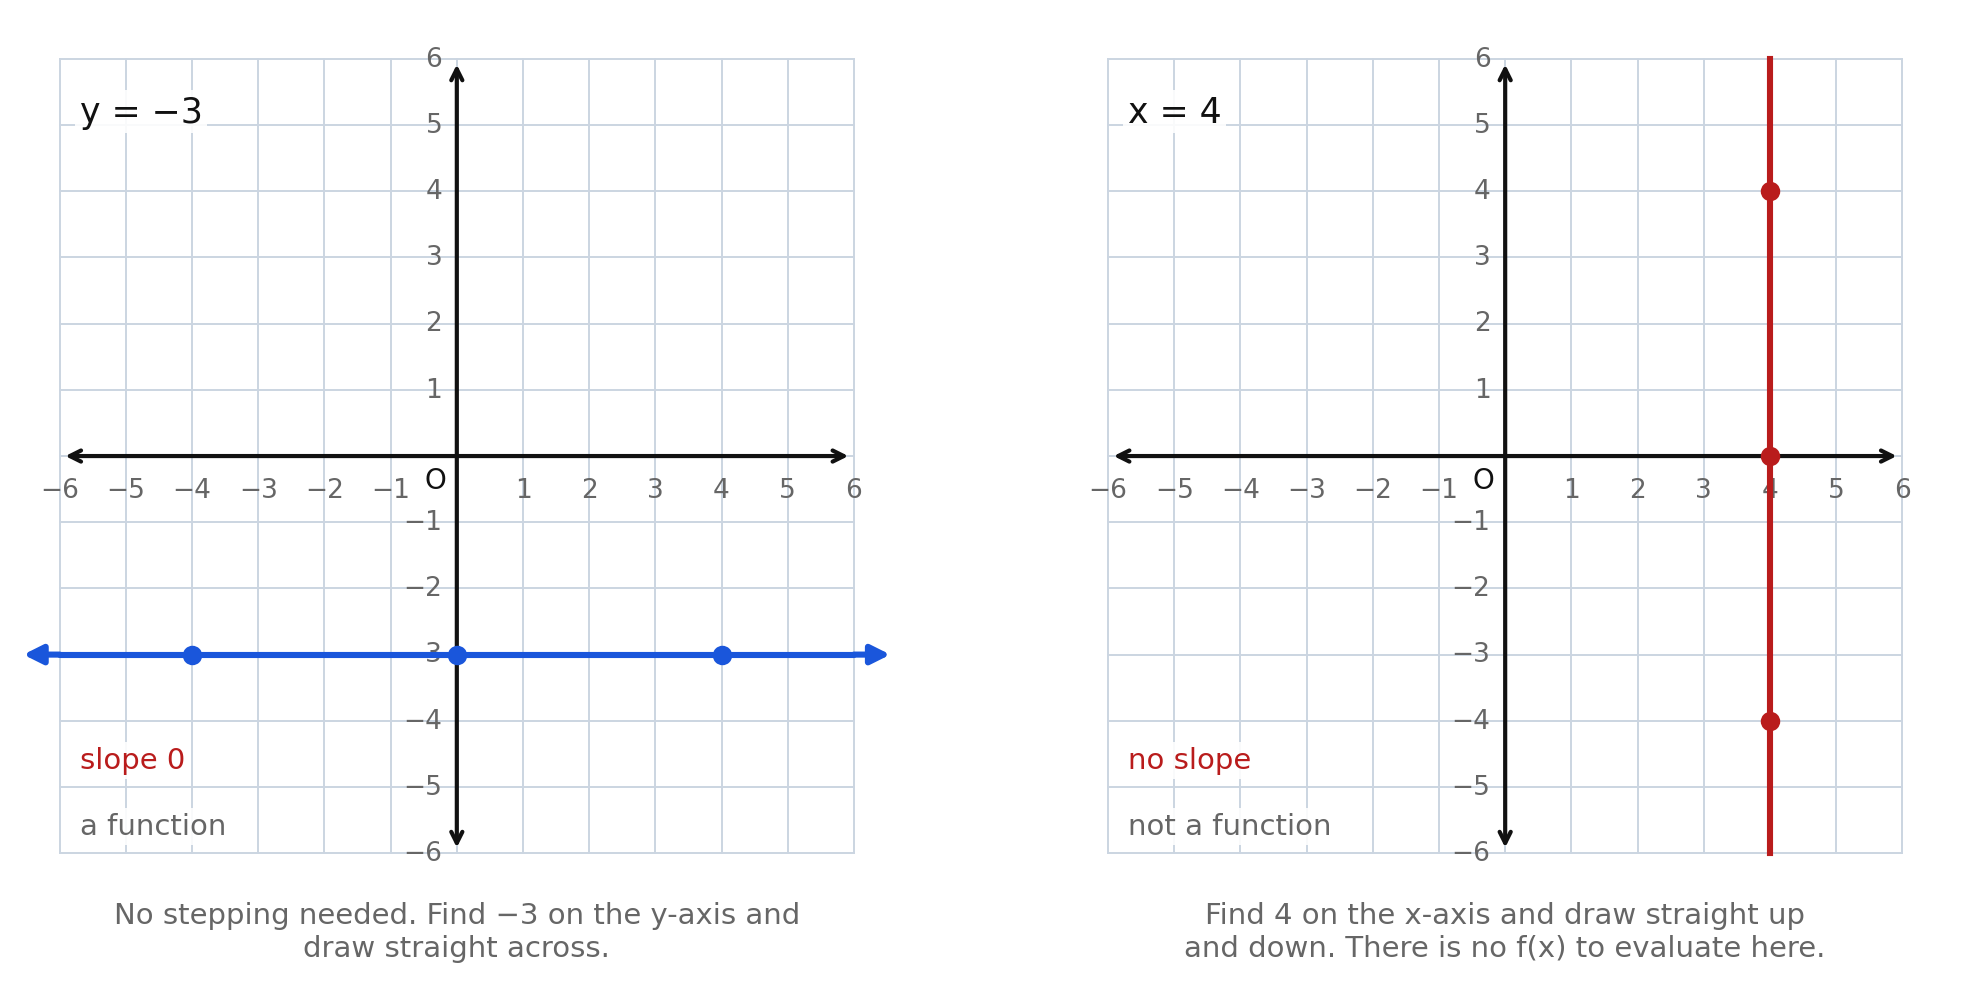
- is every point whose height is . Find on the -axis and rule a horizontal line. Its slope is , it is a function, and it has no zero.
- is every point whose first coordinate is . Find on the -axis and rule a vertical line. It has no slope and is not a function, so there is no to evaluate on it — which is why Lesson 7.4 never asks you to.
Both were written in Chapter 6 as and . Here they are drawn.
Graphing a context: choosing a scale
A bare-grid graph uses one unit per cell on both axes. A context almost never can, because the two axes count different things.
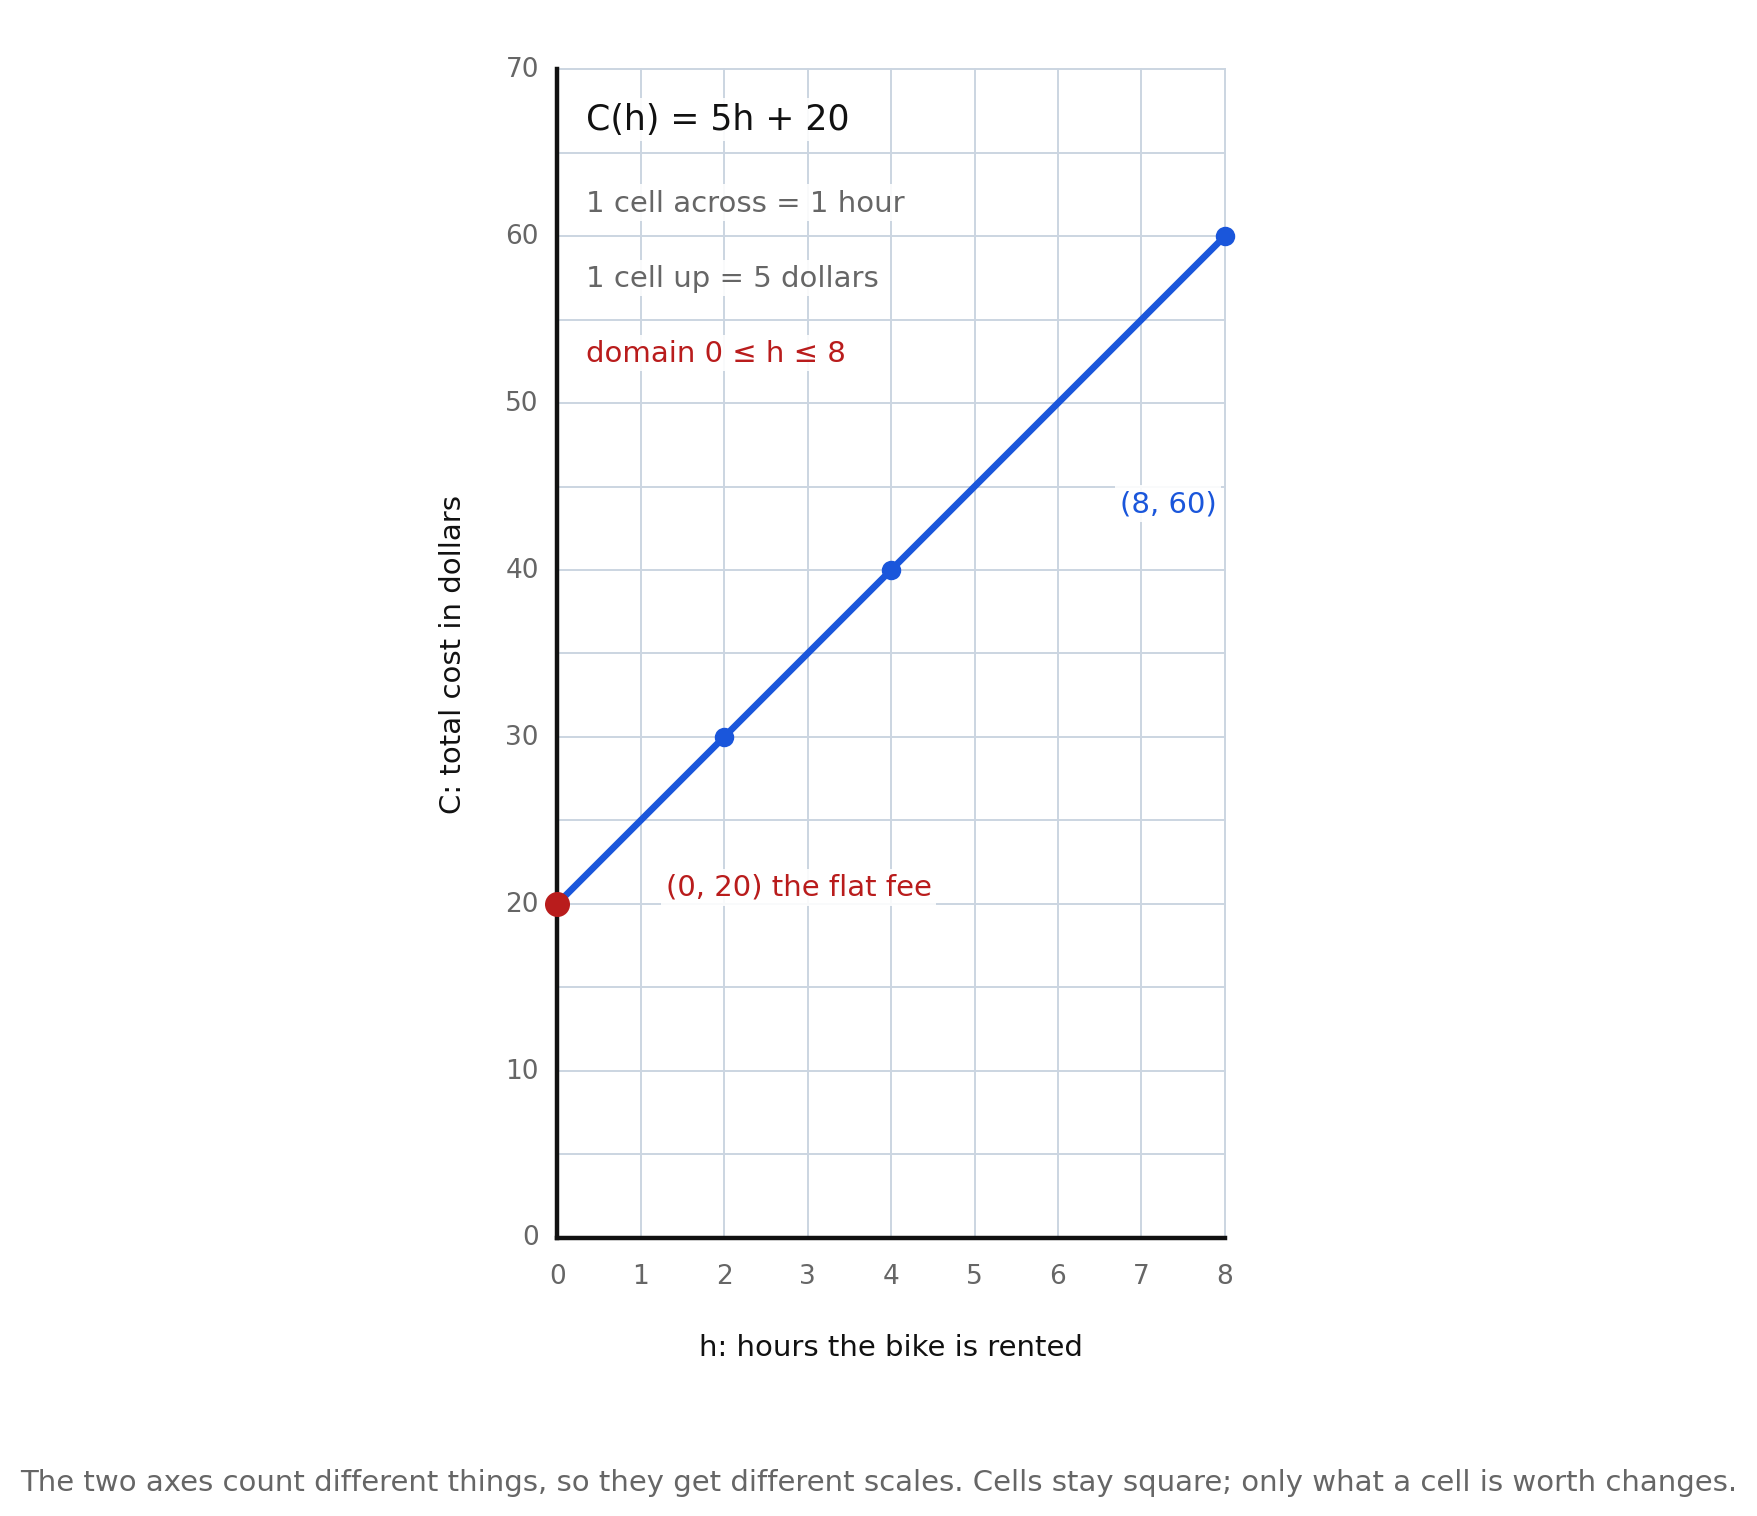
A bike shop charges a flat fee plus per hour, so the cost of an -hour rental is
Rentals run up to hours. Drawing that with one dollar per cell would need a grid cells tall.
Here is the routine.
- Find the range of inputs the story allows. Here , so the horizontal axis needs cells at hour each.
- Find the largest and smallest outputs those inputs produce. and , so the vertical axis must reach at least .
- Pick a scale that makes the picture fit and keeps the plotted points on corners. At dollars per cell, dollars is cells and every hour's cost — , , , and so on — lands exactly on a gridline.
- Label both axes with the quantity and its unit, and say what one cell is worth. An unlabeled context graph is unreadable.
- Draw a segment, not a line. The domain is , so the graph stops at both ends, with the endpoints marked, exactly as Chapter 5 taught.
A scale is not a matter of taste. Choosing dollars per cell would put somewhere between two gridlines, and every point after it too.
Worked examples
Example 1 — From intercepts
Graph by hand.
Let : , so . Let : , so .
Answer: Plot and and draw the line.
Example 2 — Choosing inputs for a table
Build a four-row table for with whole-number outputs.
The denominator of the slope is , so use multiples of .
Answer: gives .
Example 3 — A line through the origin
Why does the intercept method fail for , and what do you do instead?
Setting gives , and setting gives — the same point twice.
Answer: Both intercepts are , so you have one point, not two. Substitute a convenient input instead: gives , so plot .
Example 4 — A horizontal and a vertical line
Graph and , and say which is a function.
Answer: is horizontal through on the -axis; slope ; it is a function. is vertical through on the -axis; no slope; it is not a function.
Example 5 — Choosing a scale
A pool fills according to gallons after minutes, for . Choose scales and name the endpoints.
and .
Answer: Horizontal axis to minutes at minutes per cell; vertical axis to gallons at gallons per cell. The segment runs from to .
Guided practice
- Use the figure of . Name the two substitutions shown and the two points they produce.
- Convert to slope-intercept form, and confirm that the slope agrees with the two points plotted in that figure.
- Use the figure of . Which five inputs were chosen, and why those?
- In that same figure, what would have gone wrong with the inputs , , and ?
- Use the figure of the two special lines. Describe how you graph and how you graph without stepping off any slope, and say which of the two is a function.
- Use the bike-rental figure. State what one cell across and one cell up is worth, and give the cost of a -hour rental.
Independent practice
- Graph each by finding both intercepts. Give the two points. a) b) c) d)
- Build a four-row table for whose outputs are all whole numbers, and say how you chose the inputs.
- Build a four-row table for whose outputs are all whole numbers.
- Graph and on one grid. For each, give the slope if it has one and say whether it is a function.
- Application. Use the bike-rental function from the figure. Find and , and explain why dollars per cell is a better vertical scale than dollars per cell.
- Application. A car rental charges a fee plus per mile, so for . Choose a scale for each axis, say what one cell is worth, and give the two endpoints of the segment.
- Reasoning. For , is it faster to graph from the intercepts or to convert to slope-intercept form first? Give both intercepts, and justify your choice.
- Error analysis. A student graphs by plotting and stepping right and up , "because the slope is and the intercept is ." Identify the error and give a correct graph as two points.
- Application. A booster club sells wristbands at and shirts at toward a goal, so . Graph it from its intercepts, and say what each intercept means about the fundraiser.
- Application. A pool holds gallons and drains at gallons per minute, so for . Choose a scale for each axis and say what one cell is worth on each.
Exit ticket 7.2
- Graph from its intercepts. Name both points.
- Give four inputs for that keep every output a whole number, and give the outputs.
- Graph and . Say which is a function and give the slope of each, if it has one.
- Application. A pool fills according to gallons after minutes, for . Choose scales for both axes and give the two endpoints of the segment.
Lesson 7.3 — Graphing with Technology
What technology is for
A.F.1f names technology explicitly, and this volume takes that seriously in one specific way: the calculator confirms, it does not decide. You produce a result algebraically, you produce it again on the screen, and you compare. The habit is the same one Chapter 6 built when it checked every equation it wrote.
Algebra 1 has no no-calculator standards, and the Desmos Virginia Graphing Calculator is available for the entire End-of-Course test — so the question is never whether to use it, only how.
The one thing the calculator gets wrong for you: the window
Enter a function and press graph and you get something. Whether that something is informative is entirely up to the window you chose.
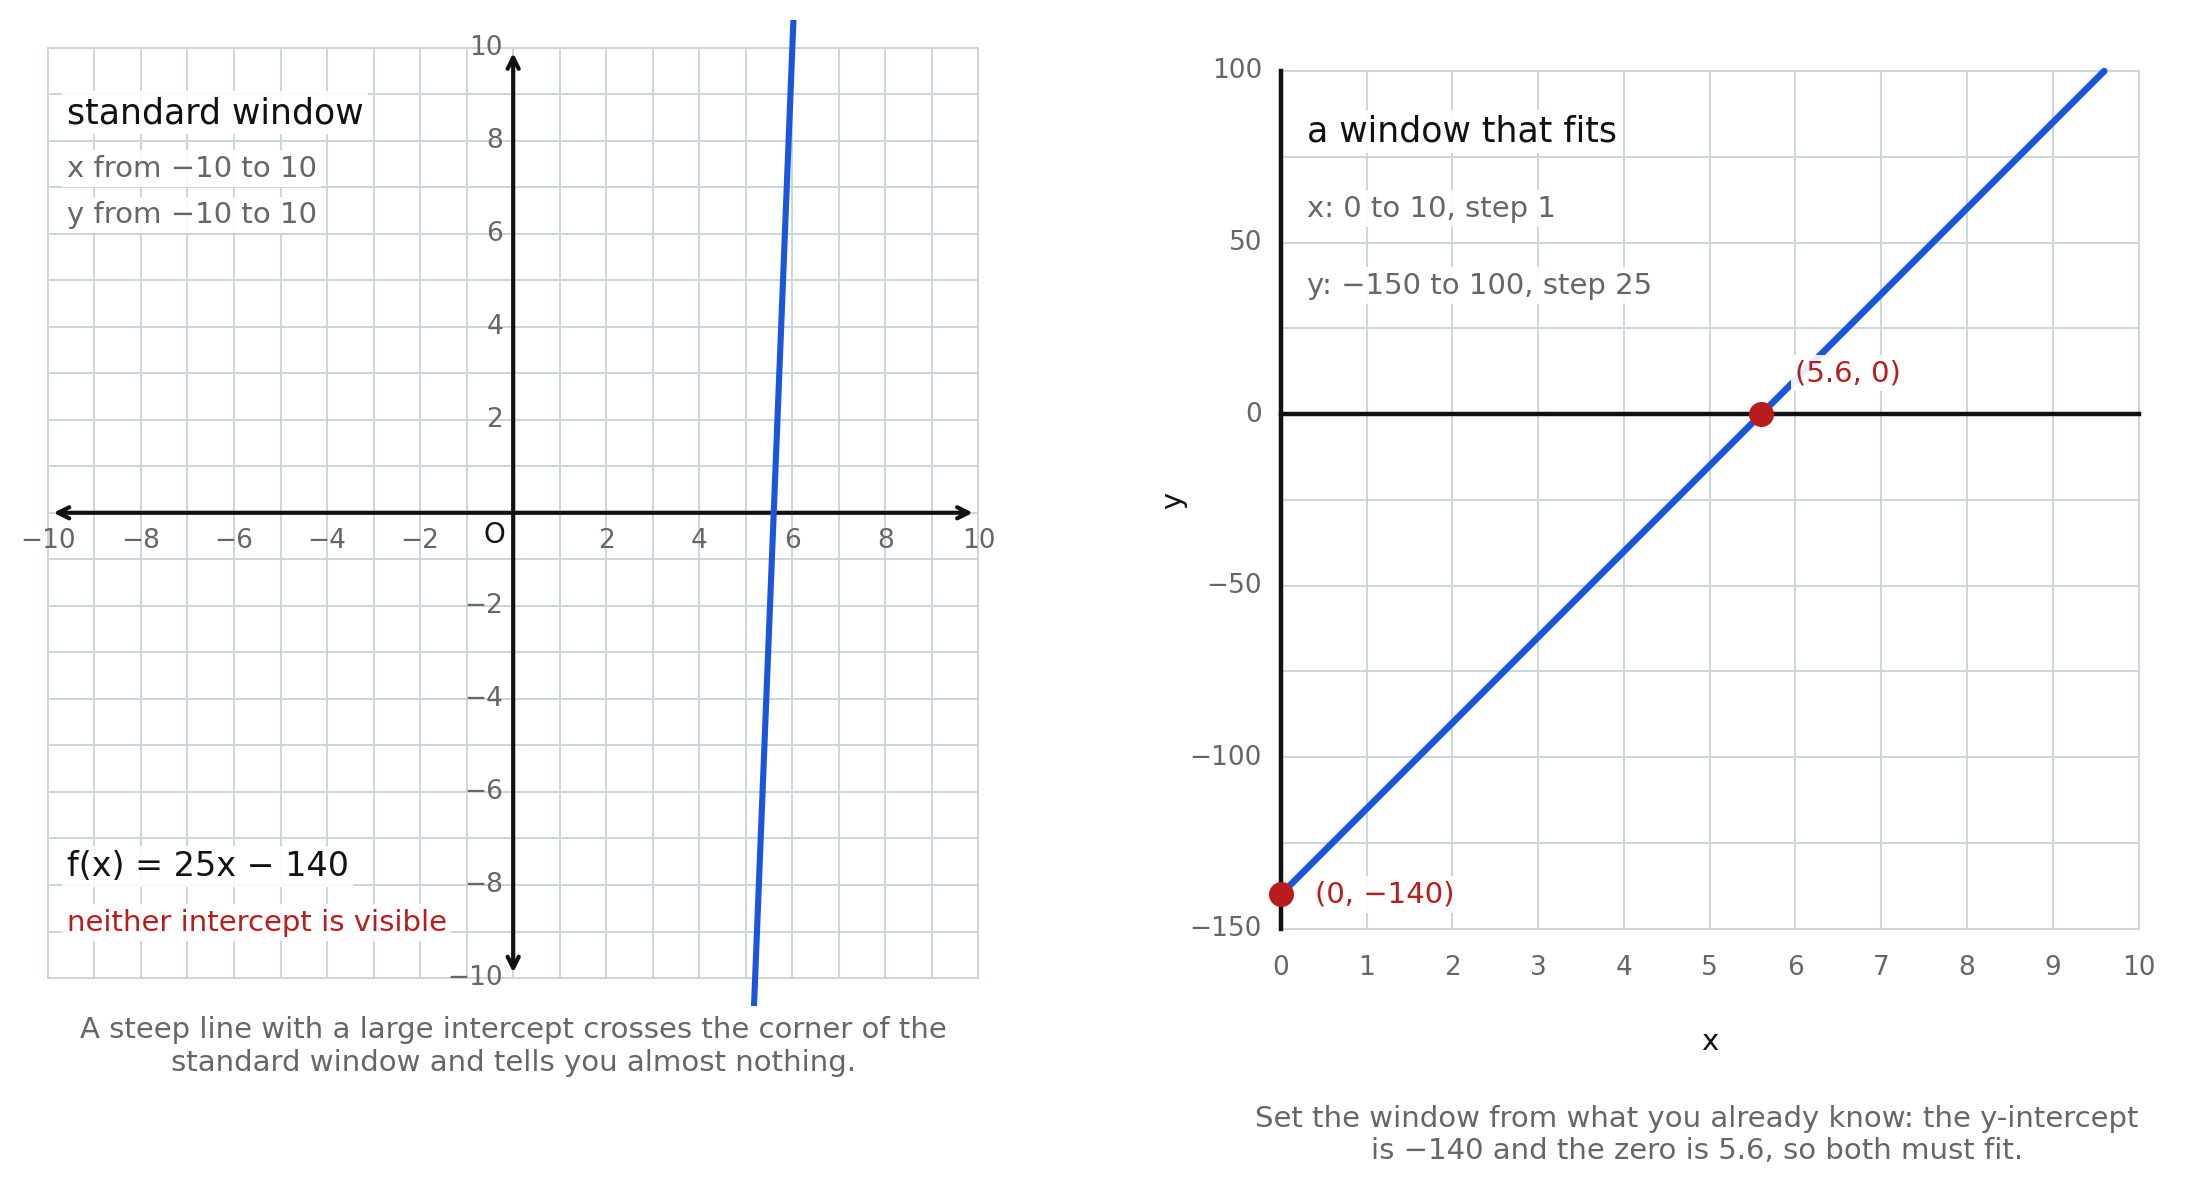
The standard window runs from to on both axes. In it, is a near-vertical stroke through one corner. Neither intercept is on the screen, and a student who trusts the picture might conclude the function has no -intercept at all.
The fix is not to hunt for a better window by trial and error. It is to work out, on paper, what the window has to contain.
- Find the -intercept. Here , so the window must reach at least that far down.
- Find the zero. gives , so the window must reach at least .
- Set the window generously around both, and choose a scale for each axis the way Lesson 7.2 did.
For this function, from to with a scale of , and from to with a scale of , shows the whole story. Both intercepts are on screen, and the tick marks are worth reading.
You will notice that step 1 and step 2 are Chapter 5's work. You need the algebra before the technology can help you, which is exactly why this chapter teaches the by-hand methods first.
The table feature
Every graphing calculator will also print a table of values, and it is the fastest way to bracket a zero when the zero is not a whole number.
For , a table stepping by from reaches
The output changes sign between and , so the zero is between them — and is. A table also lets you check a single evaluation instantly, which is the verification half of Lesson 7.4.
Reading a value off the screen
Calculators offer a "value" or "trace" command that reports at an input you type, and a "zero" or "root" command that reports where the graph crosses the -axis. Both are verification tools, and both come with a caution.
A calculator reports decimals. Some answers are not decimals. Ask a calculator for the zero of and it will say something like . The exact zero is . The screen is rounding; report the exact value, and use the decimal only to confirm it. Likewise a zero displayed as for is the number , and is what you write down.
When the two disagree
This is the rule that makes verification worth doing.
If your algebra and your graph disagree, one of them is wrong, and you are not finished. Do not average them, and do not pick the one you like. Find the error. The usual suspects, in order:
- The function was typed wrong. A missing parenthesis turns into .
- The window is hiding something. The feature you are looking for is off screen.
- A sign was dropped in the algebra. Re-solve, slowly.
If you graph and the screen shows a line falling from left to right, you have not discovered a new fact about slopes — you typed .
Worked examples
Example 1 — Setting a window from the algebra
Choose a viewing window for .
The -intercept is . The zero: gives .
Answer: from to with a scale of ; from to with a scale of . Both intercepts are then on screen.
Example 2 — Bracketing a zero with a table
Use a table for at to locate the zero.
The outputs are , , , , .
Answer: The sign changes between and , so the zero is between them. Algebraically, gives .
Example 3 — Algebra first, graph second
Solve , then describe the graphical confirmation.
, so .
Answer: . To confirm, graph and check that the point is on the line — for instance with the table feature, which should print beside the input .
Example 4 — An invisible intercept
A student graphs in the standard window and concludes it has no -intercept. What went wrong?
gives , far outside a window that stops at .
Answer: The zero is ; the window was too narrow. A window with from to shows it.
Example 5 — An exact answer behind a decimal
A calculator reports the zero of as . What is the zero?
gives .
Answer: The exact zero is , which is about . The screen is showing a rounded decimal, not a different number.
Guided practice
- Use the left panel of the window figure. Explain why the standard window is useless for .
- Find the -intercept and the zero of algebraically, and say how each one determined a number in the window on the right.
- Use the right panel of that figure. What is one cell worth on each axis?
- Choose a viewing window that shows both intercepts of , and give the two intercepts.
- A calculator table for steps by . What does it print at and at , and what does the change tell you?
- Explain in one sentence what a graph can verify about an algebraic result, and one thing it cannot establish exactly.
Independent practice
- Choose a viewing window for each function, giving the smallest and largest , the smallest and largest , and a scale for each axis. State the intercepts you used to decide. a) b) c) d)
- Application. A student saves for tuition according to dollars after weeks, for . Choose a window, and find .
- You graph and the screen shows a line through falling from left to right. Name the most likely cause and say how to check it.
- Solve algebraically, then describe exactly what you would look for on a graph of to confirm your solution.
- Error analysis. A student graphs in the standard window and writes "no -intercept." Identify the error and give the zero.
- Build the calculator table for at . Say between which two inputs the zero lies, then find the zero exactly.
- Reasoning. Two students graph the same function on the same model of calculator and get pictures that look nothing alike. Give the most likely explanation, and say what the two students should compare first.
- Application. A moving service charges dollars for miles. Find the mileage that costs algebraically, then describe the graphical check.
- Reasoning. Explain why finding a good viewing window requires knowing something about the function first, and name the two numbers you should compute before touching the calculator.
- A calculator reports the zero of as . Give the exact zero, and explain the difference between what the screen shows and what you should write.
Exit ticket 7.3
- Choose a viewing window for , and give the intercepts that justified it.
- Find for algebraically, and describe the graphical check.
- State the rule this chapter uses when an algebraic result and a graph disagree, and list two things to check first.
- Error analysis. A calculator reports the zero of as , and a student writes that as the answer. Identify the problem and give the exact zero.
Lesson 7.4 — Determining , and Recovering
Two questions, one point
A.F.1g asks two things, and they are opposite ends of the same fact.
- Given , determine . You know the input; you want the output.
- Given , determine . You know the output; you want the input that produced it.
Both name a single point on the graph. The difference is which coordinate you were handed.
| Given , find | Given , find | |
|---|---|---|
| Algebraically | substitute and simplify | set the rule equal to the output and solve |
| Graphically | from the -axis, up to the line, then over to the -axis | from the -axis, over to the line, then down to the -axis |
| Answer is | a number, the output | a number, the input |
The standard requires both directions from both representations, so all four cells of that table get worked below.
Given , determine
Algebraically, substitute the input everywhere appears and simplify. For :
Two cautions. Put the input in parentheses, especially when it is negative: , and a missing pair of parentheses is where the sign gets lost. And an input need not be an integer: is a perfectly legal question, and Chapter 1 taught you to evaluate it.
Graphically, walk the path.
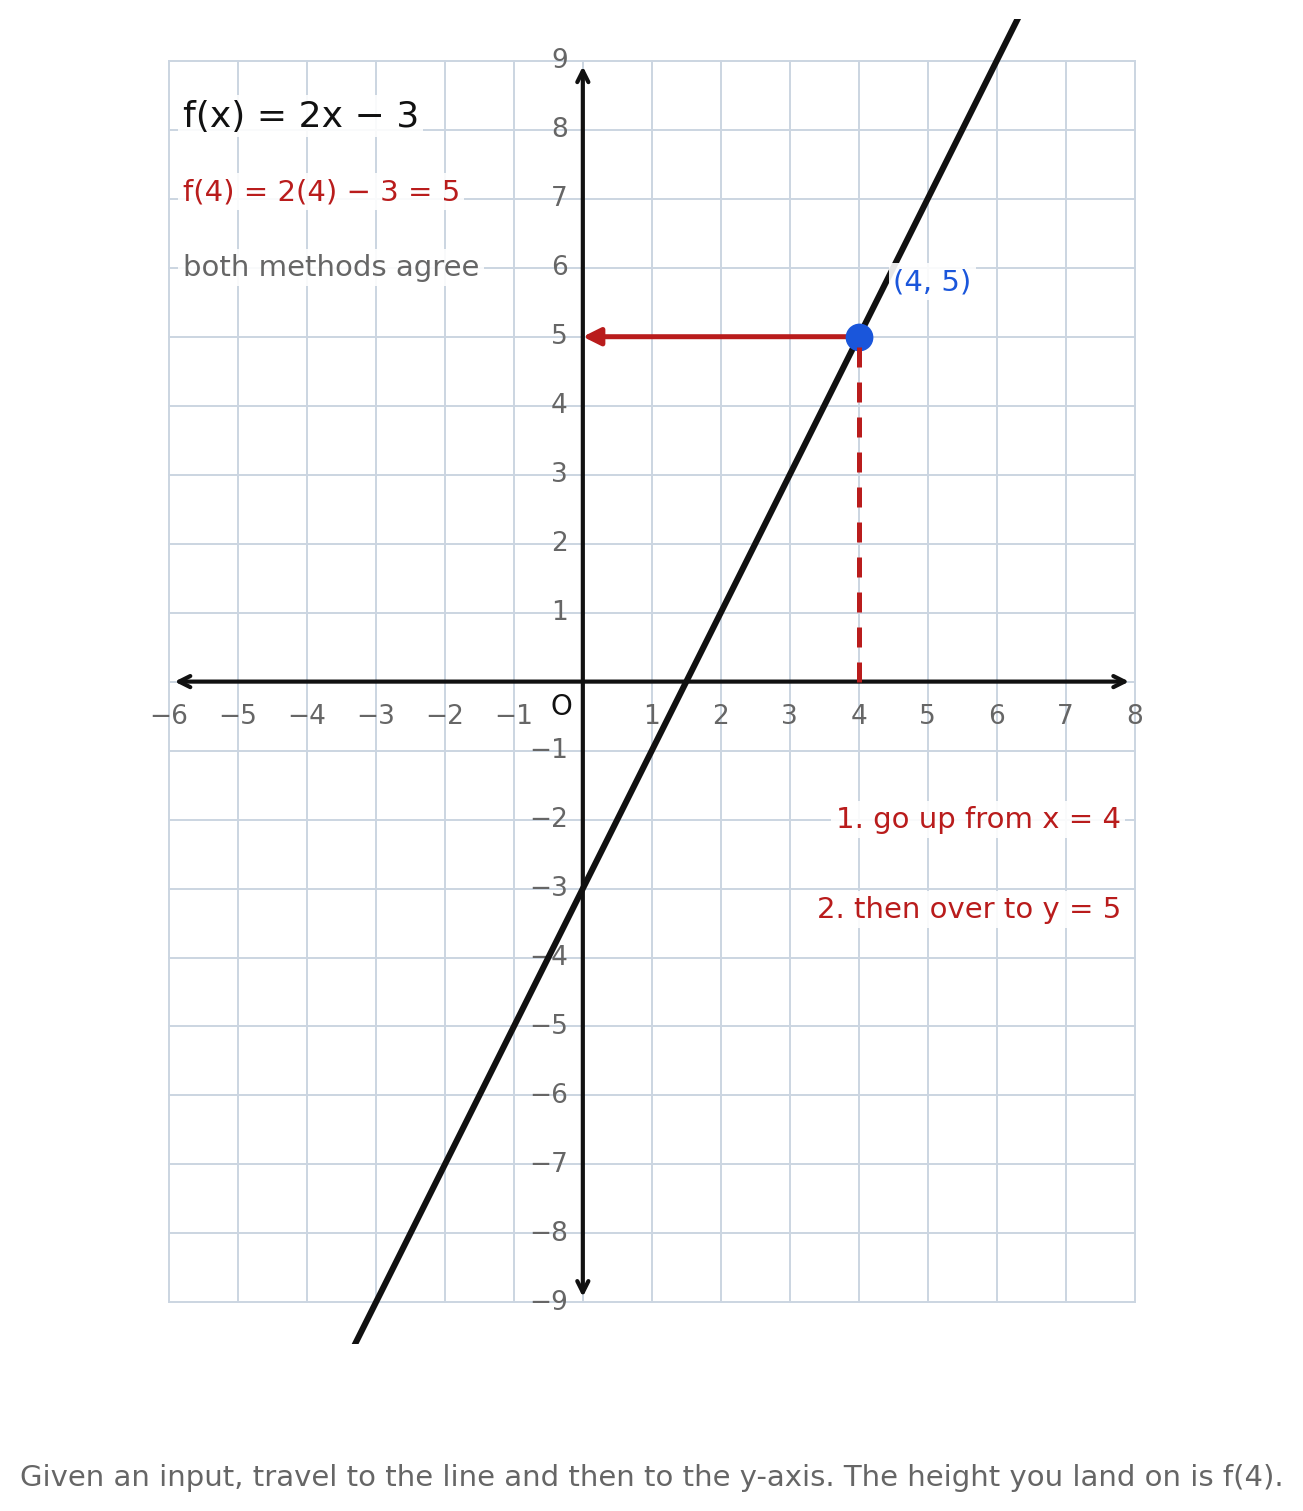
- Find the input on the -axis. Here, .
- Travel vertically to the line. Up, if the line is above the axis there; down, if it is below.
- Travel horizontally to the -axis and read the height. Here, .
So , which is what the algebra said. Two methods, one answer — that is the verification habit, done without a calculator.
Given , determine
Algebraically, this is an equation to solve — the same multi-step linear equation Chapter 2 taught. Set the rule equal to the given output.
For , find when :
Graphically, walk the same path backwards.
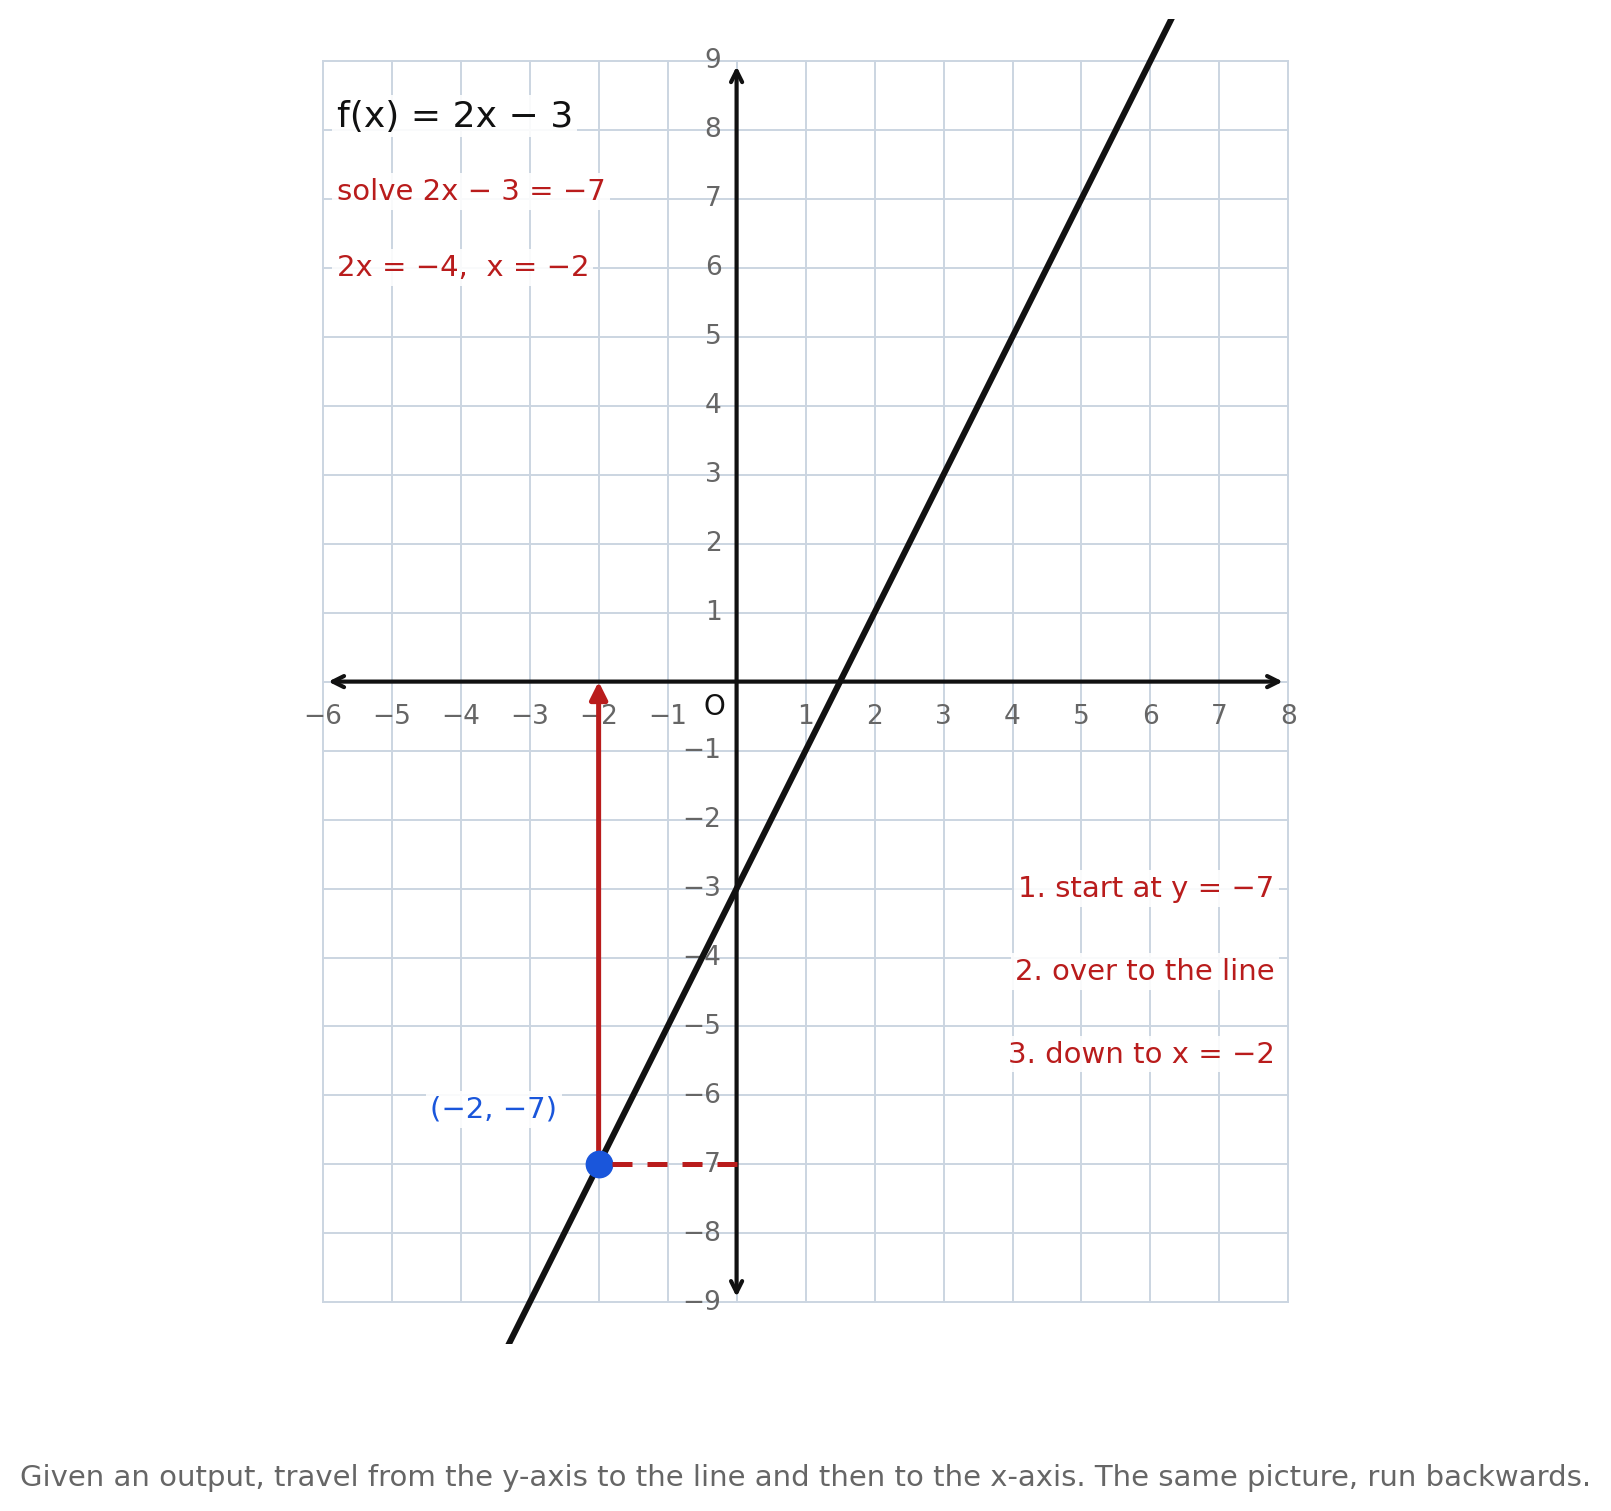
- Find the output on the -axis. Here, .
- Travel horizontally to the line.
- Travel vertically to the -axis and read the input. Here, .
The two figures show the same function in the same window with the same kind of dashed path. The only difference is which axis you start from.
The mistake this lesson exists to prevent
Asked to find when for , a great many students compute
and report . That answers the other question. The given number is an output, so it belongs on the right-hand side of an equation, not inside the parentheses:
A quick reading test: the number inside is always an input. If the problem writes , the is outside the parentheses and is therefore an output.
The zero is one instance of this
Setting and solving is the second direction with the specific output . So Chapter 5's zero is not a separate skill — it is the question "find when ", which is why the zero and the -intercept turn up in every window you choose.
Both directions in a context
A rideshare charges dollars for a ride of miles.
- Given the input. A -mile ride: , so the fare is .
- Given the output. A fare of : solve , giving and , so the ride was miles.
The second is the question a rider actually asks, and it is the one that requires solving rather than substituting. Notice that both answers carry units, and that the units differ — dollars for the output, miles for the input.
Worked examples
Example 1 — Evaluating, including a negative input
For , find and .
. .
Answer: and
Example 2 — Recovering the input
For , find when .
, so and .
Answer:
Example 3 — Reading a graph in both directions
Using the graph of , find and find when .
Up from meets the line at height . Over from on the -axis meets the line above .
Answer: ; and at . Both check algebraically: and .
Example 4 — A non-integer answer
For , find when .
, so and .
Answer: . An input recovered this way need not be a whole number.
Example 5 — Both directions in context
A room cools according to degrees after hours. Find , and find when the room reaches degrees.
. And gives , so .
Answer: After hours the room is degrees. It reaches degrees after hours.
Guided practice
- Use the figure showing the path up from . What is , and describe the two travels the dashed path makes.
- Confirm that value algebraically from .
- Using the same rule, find algebraically.
- Use the figure showing the path from . What input produced that output, and describe the path.
- Confirm that input algebraically by solving an equation.
- Explain in one or two sentences how the questions in items 61 and 64 differ, and what the two answers have in common.
Independent practice
- For , find each value. a) b) c) d)
- For , find each value. a) b) c) d)
- For , find in each case. a) b) c) d)
- For , find in each case. a) b) c) d)
- Use the graph of in the figure for reading . Read , , and off the graph, then confirm all three algebraically.
- Use that same graph. Find the for which , and the for which . Say which axis you started from.
- Application. A rideshare charges dollars for miles. Find , and find the mileage of a ride that cost . Write one sentence for each answer, with units.
- Application. A room cools according to degrees after hours. Find , and find when the room reaches degrees. Give units for both.
- Error analysis. Asked to find when for , a student computes and answers . Identify the error, say which question the student answered, and give the correct .
- Reasoning. Explain why recovering from a given is always the work of solving an equation, while finding from a given never is.
- Technology. For , find algebraically, then describe how the table feature of a graphing calculator would confirm it.
- Application. Use the bike-rental graph of from Lesson 7.2. Find and find the number of hours that costs , reading each off the graph and confirming it algebraically.
Exit ticket 7.4
- For , find , and find when .
- Use the figure for reading off a graph. State , and state the for which . Explain why one marked point answers both.
- Application. A savings balance falls according to dollars after weeks. Find , and find the week the balance reaches .
- Describe, in words, the two dashed paths in this lesson's figures: which axis each starts from, and which axis each ends at.
Lesson 7.5 — Comparing the Four Representations
The same function, four ways
A.F.1h names four representations — algebraic, graphical, tabular, contextual — and asks you to compare and contrast the characteristics of linear functions across them. This is the capstone of the linear sequence, because until now you have been working inside one representation at a time.
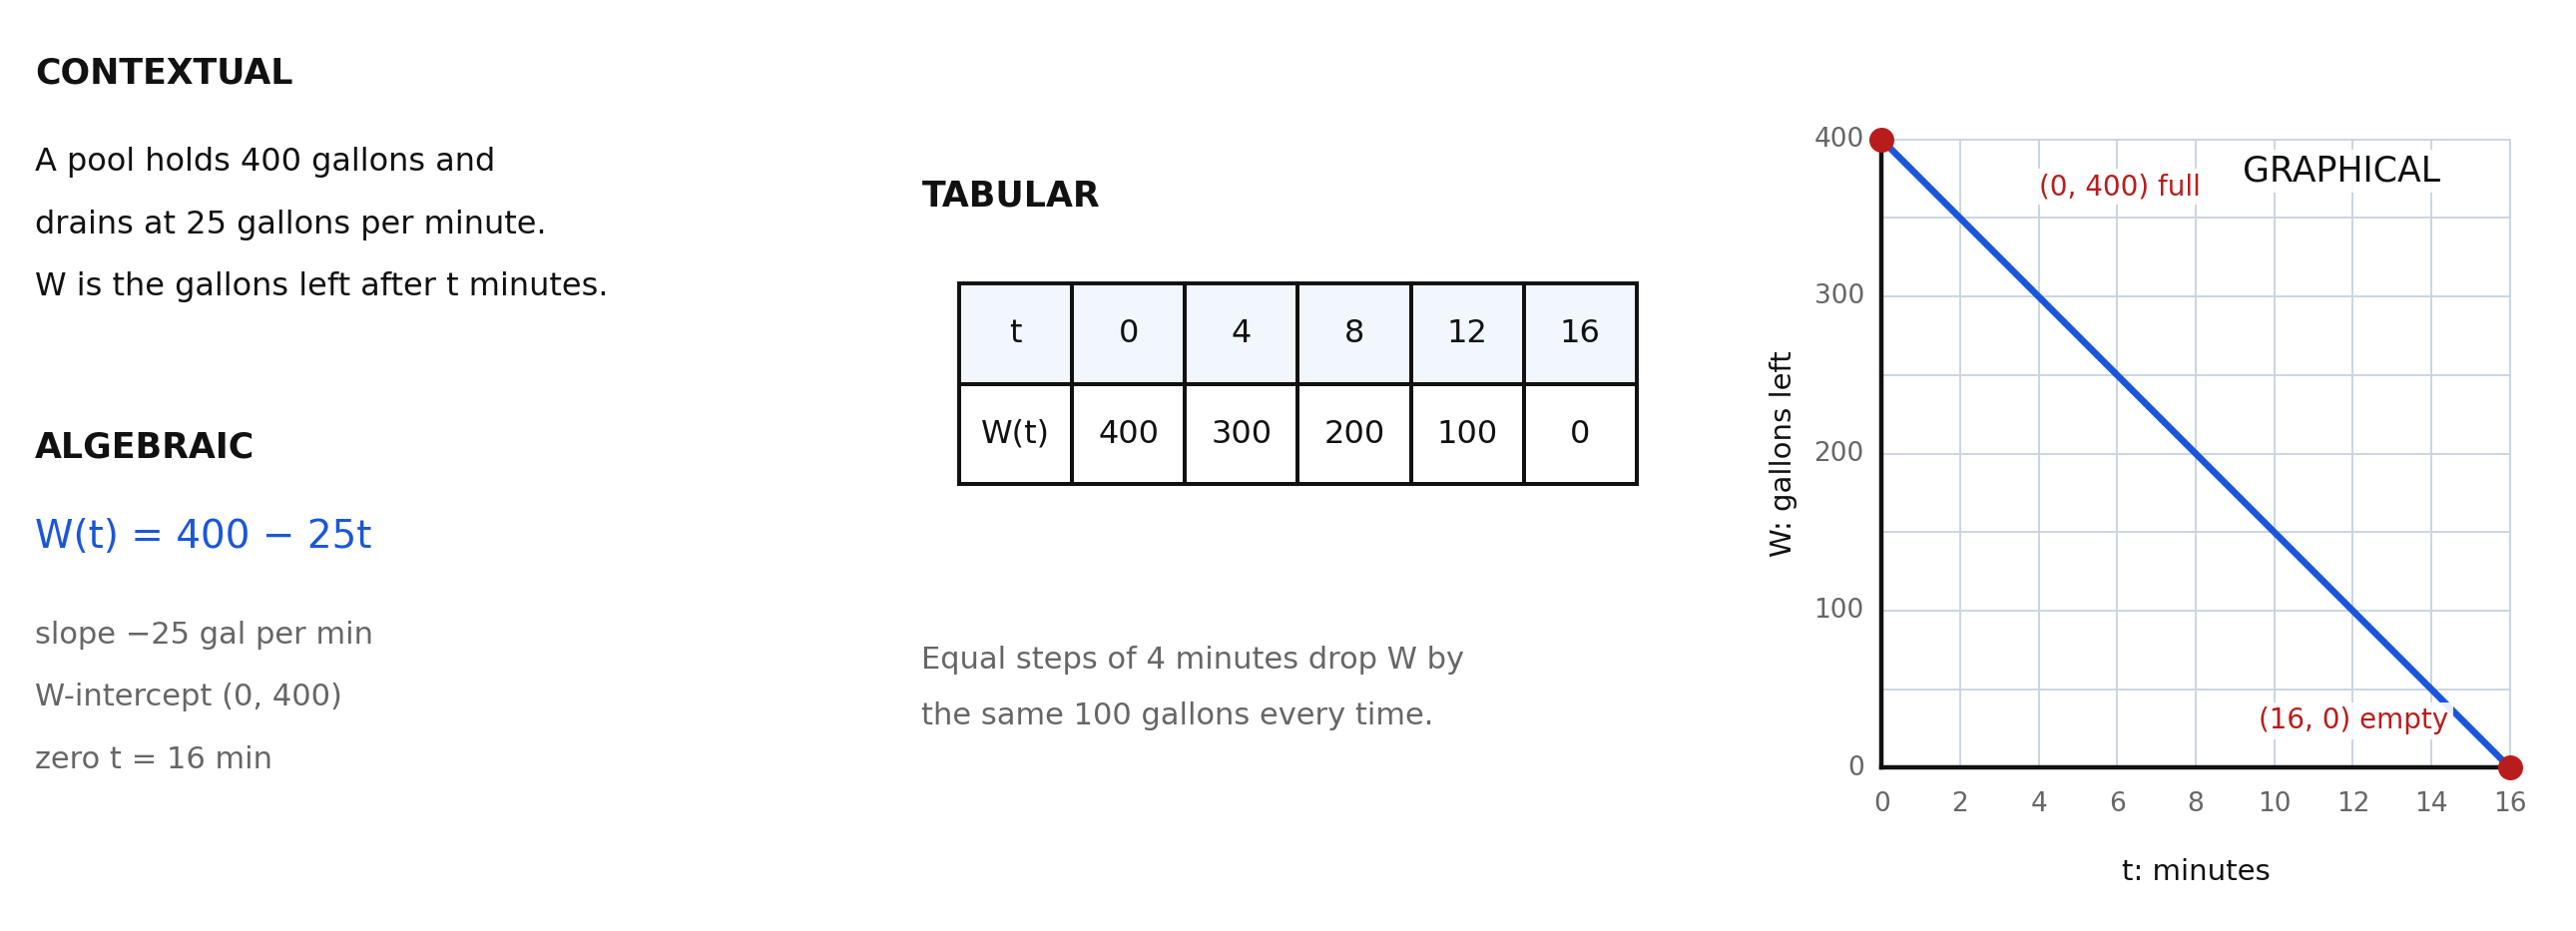
The figure carries one relationship in all four forms at once.
Contextual. A pool holds gallons and drains at gallons per minute; is the gallons left after minutes.
Algebraic. , with slope , -intercept , and zero .
Tabular.
Graphical. A segment falling from to .
All four describe the same pool. None of them contains information the others lack. But they do not display the same things with the same effort, and that is what the comparison is about.
Where each characteristic is cheapest to find
| Characteristic | Algebraic | Graphical | Tabular | Contextual |
|---|---|---|---|---|
| Slope | read the coefficient of | count rise over run | divide the change in output by the change in input | the rate named in the sentence, with units |
| -intercept | read the constant term | read where the graph crosses the -axis | read the row where , if there is one | the starting amount |
| Zero | solve | read the -intercept | look for the row where the output is | the moment it runs out |
| A specific | substitute — exact | read the height — approximate | free, if the input is in the table | not available directly |
| Domain and range | all real numbers | read the extent of the ink | only the listed values | the situation decides |
| Trend at a glance | infer from the sign of | immediate | infer by scanning | stated in words |
Three consequences are worth stating outright.
- The equation is the only exact one. A graph read by eye gives ; the equation gives . When a question says "determine," reach for the equation.
- The graph is the only one you can take in at a glance. Nobody sees a trend in an equation the way they see it in a falling line.
- The table shows constancy. Equal steps of minutes drop by the same gallons every time. That repeated difference is linearity, and it is visible in the table and nowhere else so plainly.
And one warning. A table does not always display the -intercept. Given
the slope is , but the -intercept is not — the table simply does not contain the input . Stepping back one row from gives , so the function is .
Comparing two different functions
The harder version of bullet h is comparing two linear functions that arrive in different representations. The method is to convert both to whatever form answers the question, and slope-intercept form usually does.
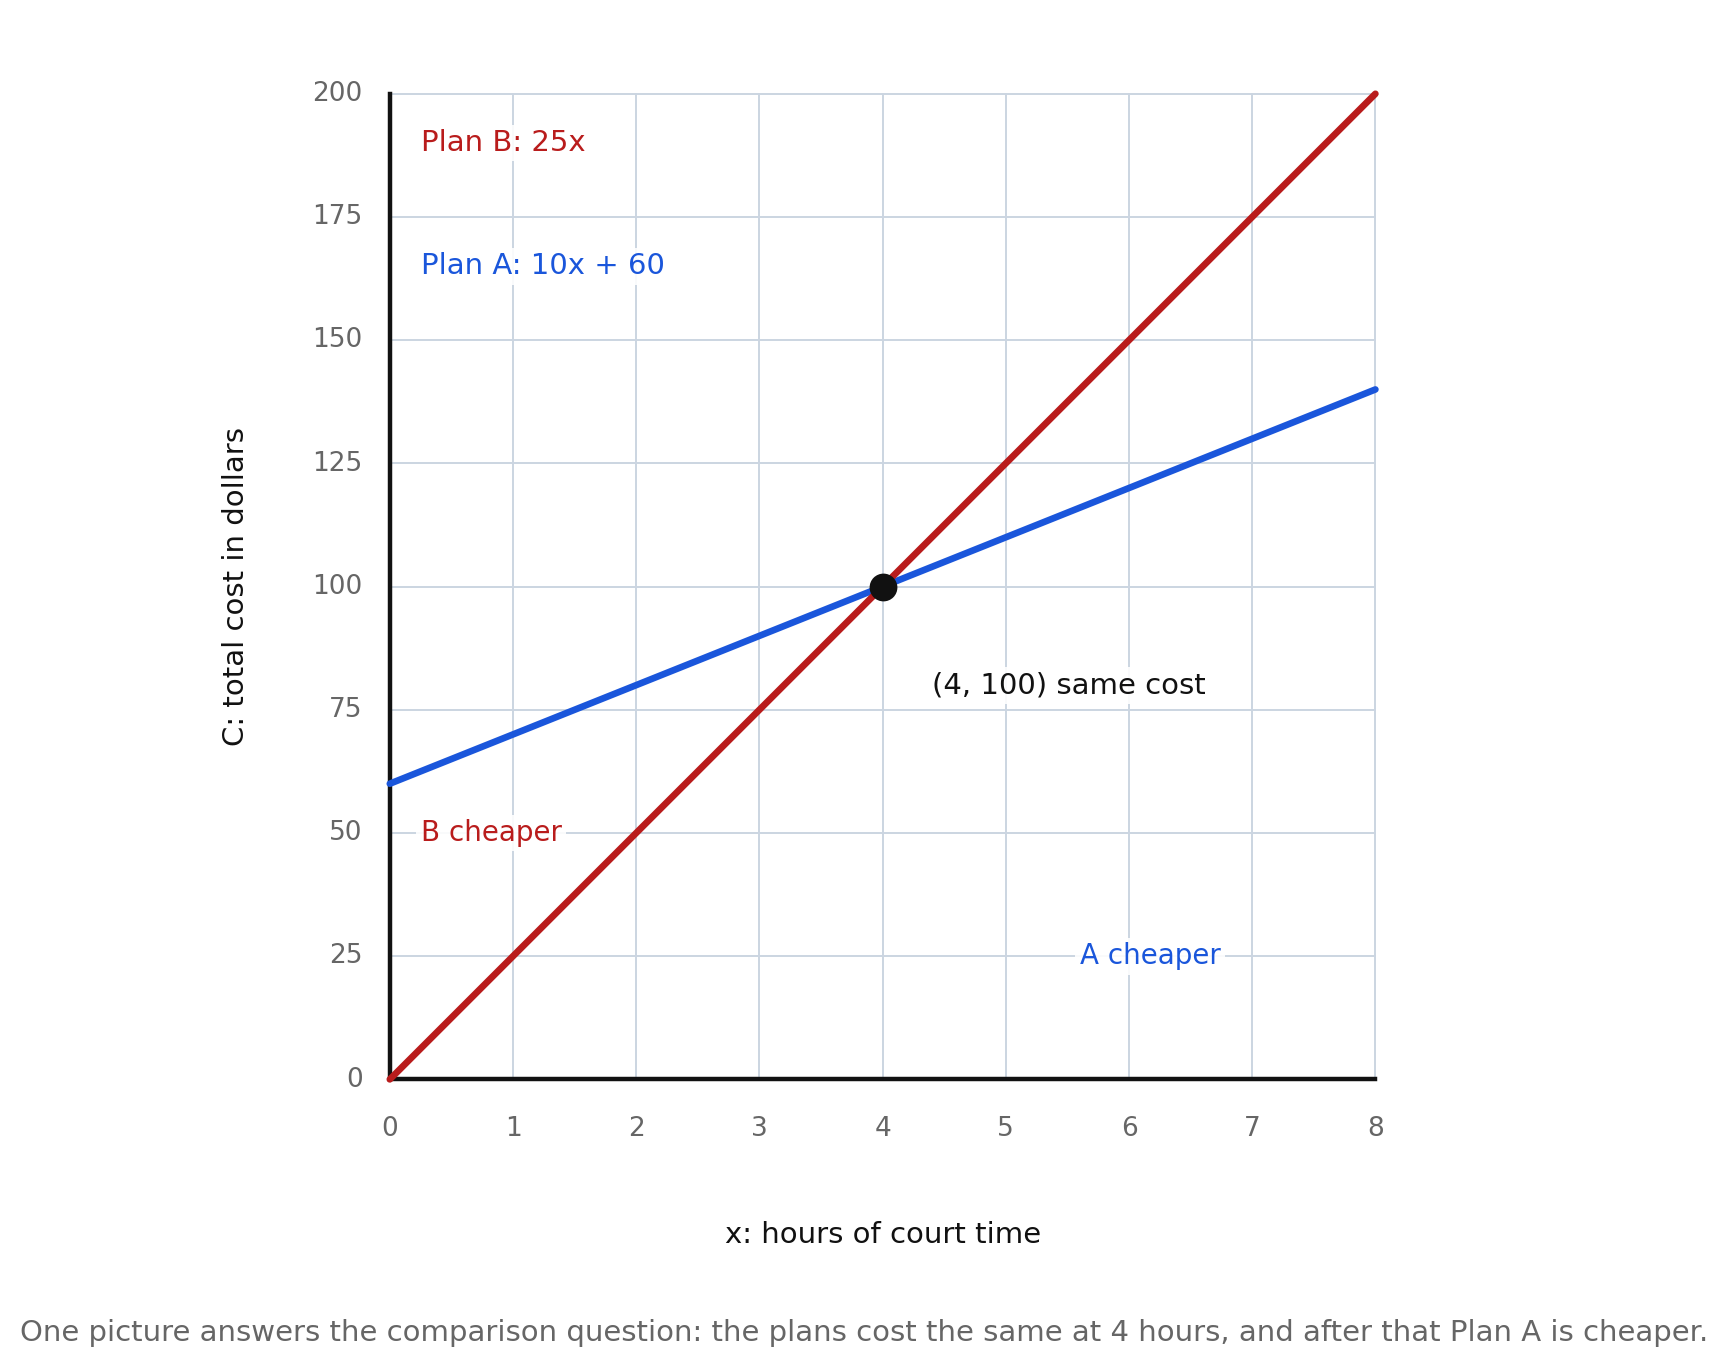
Two courts rent by the hour. Plan A charges a membership plus per hour. Plan B charges per hour and nothing else.
- Rate of change. climbs faster: per hour against per hour.
- Initial value. starts higher: against .
- Where they agree. Set the two outputs equal — a one-variable equation of the kind Chapter 2 solved:
and . The graph marks , and the two computations agree.
- Which is better, and when. Below hours, is cheaper — at hours, costs and costs . Above hours, is cheaper — at hours, costs and costs . "Which plan is better" has no answer without an amount of use, and saying so is part of the comparison.
When the slopes are equal, there is no crossing at all. and a table stepping up for every across starting at both have slope ; their graphs are parallel, and the one that starts lower stays lower forever. That is Chapter 6's parallel-lines fact, seen from the comparison side.
Choosing a representation on purpose
Given a choice, pick the one that answers the question asked.
- "Exactly how much for hours?" — the equation. Substitute.
- "When does Plan A overtake Plan B?" — the graph. Look at the crossing.
- "Is this even linear?" — the table. Check for a constant difference over equal steps.
- "What does the slope mean?" — the context. Only the story supplies units.
Worked examples
Example 1 — Building all four
A lawn service charges a trip fee plus per hour. Give the algebraic, tabular, and graphical forms.
Answer: Algebraic: . Tabular: at the outputs are . Graphical: a line from rising dollars per hour, best drawn at hour and dollars per cell.
Example 2 — A table without the intercept
A table lists , , . Give the slope and the -intercept.
Each step of in raises by , so . Stepping back from gives .
Answer: Slope ; -intercept ; the function is .
Example 3 — Comparing across two representations
is given by an equation; is given by the table , , , . Compare them.
rises for every , so its slope is , and its table shows the input with output .
Answer: Same rate of change, . has the larger initial value, against . Their graphs are parallel, so they never meet, and is greater than by at every input.
Example 4 — Comparing with a crossing
Gym A charges a month plus per class. Gym B is given by the table , , , . Which is cheaper for classes, and when do they cost the same?
. Gym B rises per classes, so .
At : and — the same. Solving gives , so .
Answer: They cost the same, , at exactly classes. Below classes B is cheaper; above , A is cheaper because its rate is lower.
Example 5 — Which representation to hand over
Someone wants to know the exact cost of a -hour rental under . Which representation, and why?
Answer: The equation. Substituting gives exactly, while reading a graph at gives an estimate and a table that stops at gives nothing at all.
Guided practice
- Use the four-representations figure. Write the algebraic rule, and state the slope, the intercept, and the zero, each with its meaning in the story.
- In that same figure, what does the table make visible that the equation does not display at a glance?
- In that same figure, what does the graph show faster than any of the other three?
- Find for that function. Say which representation you used and why the others were worse choices.
- Use the two-plans figure. Which plan is cheaper at hours, and which at hours? Give both costs each time.
- In that same figure, confirm the marked crossing point by solving one equation in one variable.
Independent practice
- A lawn service charges a trip fee plus per hour. Write the algebraic rule, build a table for , describe the graph, and write the contextual sentence that names the slope with units.
- is given as an equation; is given by the table , , , . Compare their rates of change and their initial values, and say whether the two graphs ever meet.
- is given as an equation; is described as a line falling from to . Compare the two slopes and the two initial values, and say what the comparison tells you about the graphs.
- Three functions arrive in three forms: the equation ; a table whose output rises by for every the input rises; and a context in which a seller earns per item. Rank them by rate of change, and say what made each rate visible.
- Application. Gym A charges a month plus per class. Gym B is given by the table , , , . Find the cost of classes at each gym, find where the two agree, and say which gym is better for someone taking classes a month.
- Reasoning. Name the representation you would use to find a zero exactly, and the representation you would use to see a trend instantly. Justify each choice in one sentence.
- Error analysis. Given the table , , , a student reports a -intercept of . Identify the error and give the correct slope, intercept, and equation.
- Application. A scooter rental charges to unlock plus per minute. Write the equation, build a table at minutes, describe the graph including a scale for each axis, and say what the slope means with units.
- Use the two-plans figure. Which plan's equation has the larger -intercept, what does that number mean in the story, and why does the plan with the larger -intercept still win in the long run?
- Reasoning. A table says but the equation gives . Explain what you should conclude and what you should do next.
Exit ticket 7.5
- For , build a table at , and give the slope, the -intercept, and the zero.
- Compare with the function given by the table , , . Which has the greater rate of change, which the greater initial value, and at what input do they agree?
- Application. Say which representation you would hand to each person, and why: someone who wants the exact cost of hours, and someone who wants to see when two plans cross.
- Name one thing each of the four representations shows better than the other three.
Chapter 7 Review
Vocabulary. graph · slope stepping · rise · run · intercept method · table of values · scale · viewing window · standard window · table feature · evaluate · determine · recover · representation · algebraic · graphical · tabular · contextual · rate of change · initial value
A.F.1 f, g, and h ask three different kinds of question, so this review is organized by bullet. Parts A and B are the two halves of bullet f — without technology and with it. Part C is bullet g in both directions. Part D is bullet h. Part E mixes all three in context.
Part A — Graphing without technology
- Graph by hand. Give the first point plotted, the step, and two more points.
- Graph from its intercepts. Name both points.
- Build a four-row table for whose outputs are all whole numbers, and say how you chose the inputs.
- Graph and . Give the slope of each, if it has one, and say which is a function.
- Application. A delivery van's odometer reads miles after days of a -day route. Choose a scale for each axis, say what one cell is worth, and give the two endpoints of the segment.
Part B — Graphing with technology
- Choose a viewing window for that shows both intercepts, and give the intercepts that justified it.
- Solve algebraically, then describe precisely what you would look for on a graph of to confirm it.
- Error analysis. A student solves an equation and gets , then graphs the function and sees the crossing near . The student writes "about ." Identify what is wrong with that response, and state what the student should do instead.
Part C — Determining and recovering
- For , find and .
- For that same function, find when , and find when .
- Use the figure showing the path from an output back to an input. Read off the graph, and give the for which . Explain why one point answers both.
- Application. A vendor's profit is dollars on items. Find , and find how many items give a profit of . Give units for both.
- Using the two evaluation figures, explain in two or three sentences why finding and recovering are the same picture travelled in opposite directions.
Part D — Comparing representations
- Use the four-representations figure. Name, for each of the four representations, one characteristic it displays faster than the other three.
- Compare with the function given by the table , , . Compare their rates of change and their initial values, and say whether the graphs meet.
- Use the two-plans figure. Write one sentence, with units, that a customer could act on, naming the crossing point and what happens on each side of it.
Part E — Mixed application
- Application. A courier charges dollars for a package of pounds. Choose a scale and describe the by-hand graph for ; find ; find the weight of a package that cost ; and interpret the slope and the -intercept with units.
- Application. A candle is inches tall and burns down inches per hour, so . Build a table at ; give the zero and say what it means; choose a scale for a by-hand graph; describe how a graphing calculator would confirm the zero; and say which of the four representations you would use to find the height at exactly hours, and why.
Standards coverage check — Chapter 7
A.F.1f names two modes of graphing and A.F.1g names two directions of evaluation from two kinds of representation, so coverage of those bullets is broken out accordingly.
| Knowledge and Skill | Component | Where it is taught | Where it is practiced | Where it is interpreted in context |
|---|---|---|---|---|
| A.F.1f — graph a linear function in two variables, with and without the use of technology, including those that can represent contextual situations | Without technology: slope stepping | 7.1 (plot , write as a fraction, step in either direction, check with a third point) | 1–12, 14, 16–20; 103 | 13, 15 |
| A.F.1f | Without technology: intercept method | 7.2 (one substitution per intercept; the through-the-origin blind spot) | 21, 22, 27, 33, 34, 37; 104 | 35 |
| A.F.1f | Without technology: table of chosen inputs | 7.2 (choose multiples of the denominator of the slope) | 23, 24, 28, 29, 38; 105 | — |
| A.F.1f | Without technology: and | 7.2 (no stepping; which one is a function) | 25, 30, 39; 106 | — |
| A.F.1f | Contextual graphs and scale | 7.2 (the five-step scaling routine; segment, not line) | 26, 36; 105 | 31, 32, 35, 40, 107, 119, 120 |
| A.F.1f | With technology | 7.3 (setting a window from the intercepts; the table feature; exact versus displayed values; the disagreement rule) | 41–47, 49–53, 55–60; 108, 109, 110 | 48, 54 |
| A.F.1g — for any value in the domain of , determine , and determine given any value in the range of , given an algebraic or graphical representation | Given , find — algebraically | 7.4 (substitute in parentheses; non-integer inputs) | 62, 63, 67, 68; 111 | 73, 74, 77, 81, 114 |
| A.F.1g | Given , find — graphically | 7.4 (up from the -axis, over to the -axis) | 61, 71, 80; 113 | 78 |
| A.F.1g | Given , recover — algebraically | 7.4 (set the rule equal to the output and solve; the zero as the case ) | 65, 69, 70, 75, 76, 79; 112 | 73, 74, 81, 114 |
| A.F.1g | Given , recover — graphically | 7.4 (over from the -axis, down to the -axis) | 64, 72, 80, 82; 113, 115 | 78 |
| A.F.1h — compare and contrast the characteristics of linear functions represented algebraically, graphically, in tables, and in contextual situations | Algebraic | 7.5 (the only exact representation; where each characteristic is read) | 83, 89, 90, 92, 95, 99, 100, 102; 116, 117 | 93, 96, 101, 119, 120 |
| A.F.1h | Graphical | 7.5 (trend at a glance; the crossing point of two models) | 85, 87, 88, 91, 94, 97, 102; 116, 118 | 93, 96, 101, 120 |
| A.F.1h | Tabular | 7.5 (constant difference over equal steps; the missing-intercept trap) | 84, 90, 92, 93, 95, 99, 100, 102; 116, 117 | 89, 96, 120 |
| A.F.1h | Contextual | 7.5 (only the story supplies units; "better" needs an amount of use) | 86, 94, 98, 102; 116 | 89, 93, 96, 97, 101, 118, 119, 120 |
Supporting items: 10, 16, 34, 51, 60, 75, 95, 110 are error analyses aimed at the eight most common failures in the chapter — inverting the slope fraction, mistaking for an -coordinate, reading standard form as slope-intercept form, trusting an empty window, copying a rounded decimal, evaluating when the question asked you to solve, reading a table's first row as the intercept, and splitting the difference when algebra and a graph disagree. Items 6, 8, 9 and 103–106 are the by-hand graphing that Grid A through Grid D in the workbook are provided for.
Boundaries respected. No item asks the student to identify or interpret domain, range, zeros, slope, or intercepts as the object of the question, or to convert between the three forms as an end in itself — those are A.F.1 a, b, and c, in Chapter 5, and they appear here only as tools already owned. No item asks the student to write the equation of a line from a graph, from two points, or from a slope and a point, and no item mentions parallel or perpendicular lines as something to construct — those are A.F.1 d and e, in Chapter 6; the parallel case appears in Lesson 7.5 only as an observed consequence of two given functions having equal slopes. No item asks for a system of two equations to be solved by substitution or elimination; the two-model comparisons in Lesson 7.5 are settled by reading a graph and by solving a single one-variable equation, and systems proper are Chapter 8. Nothing in this chapter is described as calculator-free: Lesson 7.1 and Lesson 7.2 teach graphing without technology because A.F.1f names that mode by name, not because the tool is prohibited.
Answer keys for every item in this chapter are in Appendix A.