Chapter 17 — Mean as a Balance Point; Outliers
Standard: 6.PS.2 — The student will represent the mean as a balance point and determine the effect on statistical measures when a data point is added, removed, or changed.
By the end of this chapter you will be able to:
- Represent the mean of a set of data graphically as the balance point on a line plot (dot plot) (6.PS.2a)
- Determine the effect on measures of center when a single value of a data set is added, removed, or changed (6.PS.2b)
- Observe patterns in data to identify outliers and determine their effect on mean, median, mode, or range (6.PS.2c)
Lessons: 17.1 Mean as a Balance Point · 17.2 Measures of Center and Range · 17.3 What Happens When Data Changes · 17.4 Outliers and Their Effect
Lesson 17.1 — Mean as a Balance Point
A second way to see the mean
You already know one way to find the mean of a data set: add the values and divide by how many there are.
For the data , , :
That is the arithmetic. This lesson adds a picture that explains why the answer lands where it does.
Plot the data on a line plot, also called a dot plot, by stacking one dot above each value on a number line. Now imagine the number line is a board and each dot is a one-pound weight. The balance point is the place where you could put a single support and have the board stay level. That point is the mean.
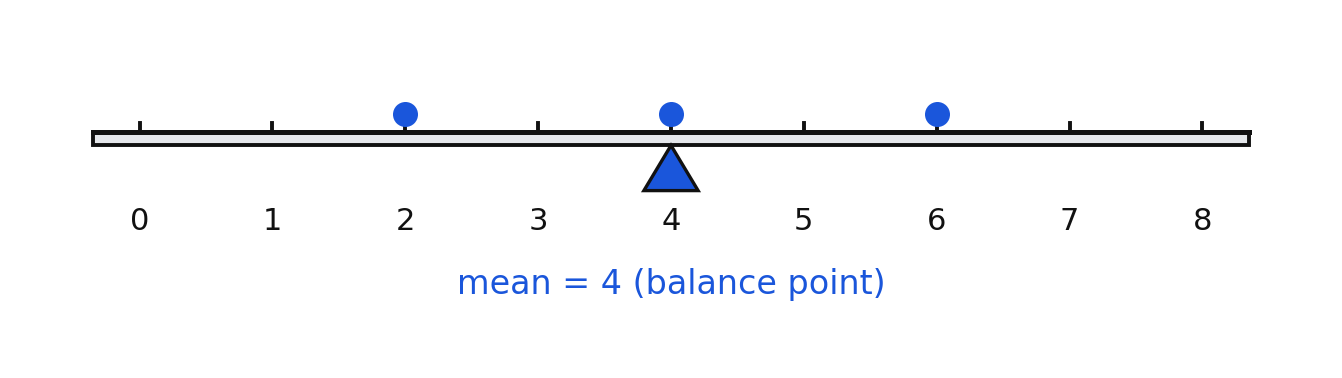
Why it balances
Look at how far each value sits from the mean of :
| Value | Distance from mean | Side |
|---|---|---|
| left | ||
| on the point | ||
| right |
The total distance on the left is , and the total distance on the right is . They match, so the board balances.
This is the defining property of the mean:
At the mean, the total distance of the values on the left equals the total distance of the values on the right.
That balance is exact for every data set, no matter how lopsided the data looks.
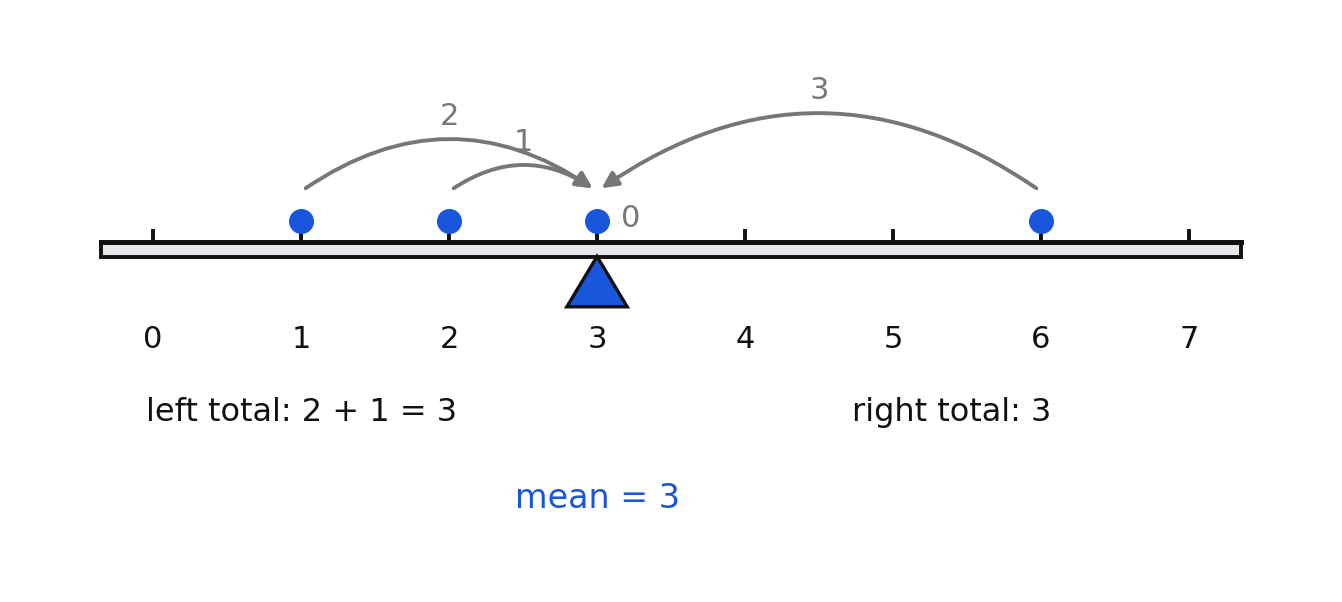
For the data , , , :
Left distances: . Right distance: . Balanced.
Notice that one far-away value on the right, the , balances two closer values on the left. A single value far from the rest pulls the balance point strongly toward itself. That idea returns in Lesson 17.4.
Two things the balance picture explains
- The mean does not have to be a value in the data set. For and , the mean is , and no dot sits at . The balance point is a location, not a data value.
- The mean is always between the least and greatest values. A support outside the dots could never balance the board.
Worked examples
Example 1 — Find the balance point
Find the mean of , , and check that it balances.
Distances from : left ; right .
Answer: The mean is , and the left and right distances are both , so is the balance point.
Example 2 — An uneven set
Find the mean of , , , and check the balance.
Left distances: and , totaling . Right distance: .
Answer: The mean is ; left total equals right total .
Example 3 — Five values
Find the mean of , , , , and check the balance.
Left distances: . Right distance: .
Answer: The mean is , and both sides total .
Example 4 — Reading a dot plot
A dot plot shows dots at , , , and . Find the balance point.
Left distances: . Right distance: .
Answer: The balance point is .
Example 5 — Testing a guess
Is the balance point of , , , , ?
Distances from : left ; right . The sides do not match, so is too far right. Compute the mean:
Check : left ; right . Balanced.
Answer: No. The balance point is , not .
Guided practice
- Find the mean of , , , , then check the left and right distances.
- Find the mean of , , , .
- A dot plot has dots at , , , and . Find the balance point.
- Is the balance point of , , , ? Show your check.
- Explain in one or two sentences why the mean is called the balance point.
Independent practice
- Find the mean of , , , , .
- Find the mean of , , , , then show the left and right distances match.
- A dot plot shows dots at , , , , , , , . Find the balance point and verify the distances balance.
- A data set is , , , and its mean is . Find the missing value.
- Four values have a mean of . Three of them are , , and . Find the fourth.
- Application. Daily high temperatures for five days were , , , , and degrees. Find the mean, then explain what the balance picture shows about how the temperatures are spread around it.
- Reasoning. Give a data set of two values whose mean is not one of the values, and explain why the balance point can sit where there is no dot.
Exit ticket 17.1
- Find the mean of , , , .
- For the data in question 1, give the total distance on each side of the mean.
- The data set , , has a mean of . Find the missing value.
- Explain what "balance point" means for a dot plot.
Lesson 17.2 — Measures of Center and Range
Three centers and one spread
A measure of center is a single number that describes what is typical in a data set. There are three of them, and they answer slightly different questions.
- The mean is the sum of the values divided by the number of values. It is the balance point.
- The median is the middle value once the data are in order. With an even number of values, it is the mean of the two middle values.
- The mode is the value that appears most often. A set can have one mode, more than one mode, or no mode at all.
The range is not a center. It measures spread:
Order first. The median is only the middle value after the data are put in order. Skipping that step is the most common median mistake.
A worked set, all four measures
Data: , , , , . The values are already in order.
Median: five values, so the middle is the third one, .
Mode: appears twice; every other value appears once, so the mode is .
Notice the mean, , is larger than the median, . The value sits far to the right and pulls the balance point toward it, while the median only cares about position in the ordered list. That difference matters in the next two lessons.
Even-numbered sets
Data: , , , .
There are two middle values, and , so:
No value repeats, so there is no mode. That is a complete and correct answer; do not invent one.
More than one mode
Data: , , , , , .
Both and appear twice, more often than any other value, so the set has two modes: and .
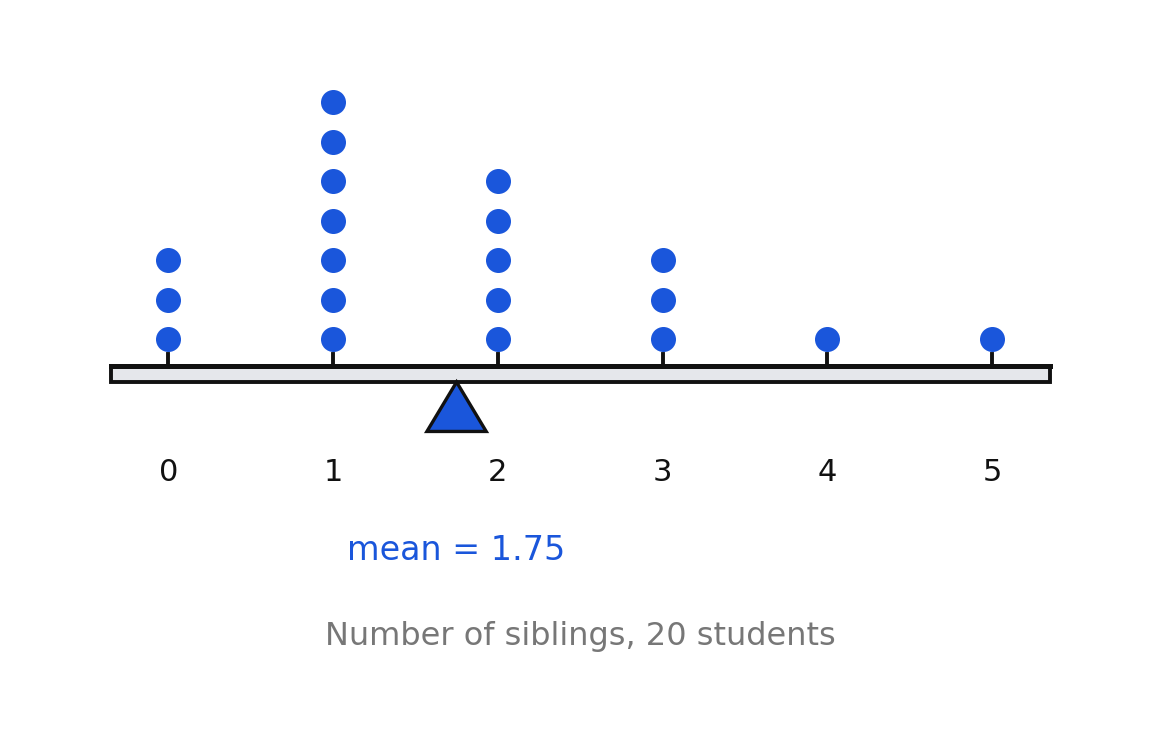
Reading measures from a dot plot works the same way. In the figure, the tallest stack is above , so the mode is . There are 20 dots, so the median is the mean of the 10th and 11th values in order; counting the stacks gives a 10th value of and an 11th value of , so the median is . The sum of all the values is , so the mean is . The range is .
Worked examples
Example 1 — All four measures
Find the mean, median, mode, and range of , , , , .
Middle of five ordered values is the third: . Most frequent value: . Range: .
Answer: Mean ; median ; mode ; range .
Example 2 — An even number of values
Find all four measures for , , , .
Answer: Mean ; median ; no mode; range .
Example 3 — Two modes
Find all four measures for , , , , , .
Answer: Mean ; median ; modes and ; range .
Example 4 — Unordered data
Find the median and range of , , , , .
Order them first: , , , , . The middle value is .
Also, .
Answer: Median ; range . (Mean ; mode .)
Example 5 — Choosing a measure
Five students report the money in their pockets: , , , , . Which measure of center best describes a typical amount?
No student is anywhere near ; the single large value pulled the balance point far right.
Answer: The median, , better describes a typical amount, because the one very large value pulls the mean away from the rest of the data.
Guided practice
- Find the mean, median, mode, and range of , , , , .
- Find the mean, median, mode, and range of , , , , .
- Find the mean, median, mode, and range of , , , , , , , .
- Find the range of , , , .
- Explain why you must order the data before finding the median.
Independent practice
- Find all four measures for , , , , .
- Find all four measures for , , , , , .
- Find all four measures for , , , .
- Find all four measures for , , , , , .
- Use the sibling dot plot in this lesson. Find the mean, median, mode, and range of the 20 values.
- Application. Seven quiz scores are , , , , , , . Find all four measures, then state which measure you would report to describe a typical score and why.
- Reasoning. Build a data set of five values whose mean is greater than its median. Explain what feature of your data makes that happen.
Exit ticket 17.2
- Find the mean, median, mode, and range of , , , .
- Find the median of , , , , .
- Find the range of , , , .
- Explain how a data set can have no mode.
Lesson 17.3 — What Happens When Data Changes
One value can move the center
Data sets are rarely finished. A new student joins the class, a score is dropped, a typo is corrected. This lesson asks a precise question: when a single value is added, removed, or changed, what happens to the mean, the median, the mode, and the range?
The balance picture from Lesson 17.1 predicts the mean's behavior before you compute anything.
| Change | Effect on the mean |
|---|---|
| Add a value greater than the mean | The mean increases |
| Add a value less than the mean | The mean decreases |
| Add a value equal to the mean | The mean stays the same |
| Remove a value greater than the mean | The mean decreases |
| Remove a value less than the mean | The mean increases |
| Change a value to something larger | The mean increases |
The median behaves differently. It depends only on position in the ordered list, so a change far out at one end may move it a little or not at all.
Adding a value
Start with , , , , .
Now add . The data become , , , , , .
The mean jumped by , the median moved only , and the range doubled. The new value was far above the old mean, so it pulled the balance point strongly toward itself.
Adding a value equal to the mean
Start with , , , : mean , median , range .
Add . The data become , , , , .
Nothing moved. Adding a weight exactly at the balance point does not tip the board.
Removing a value
Start with , , , , : mean , median , range .
Remove . The data become , , , .
Removing a value above the mean pulled the mean down.
Changing a value
Start with , , , : mean , median , range .
Change the to . The data become , , , .
The mean rose and the range grew, but the median did not budge, because the two middle values never changed.
A useful habit. When a problem asks about the effect of a change, compute all four measures before and after and put them in a table. The pattern is much easier to see side by side than in a paragraph.
Worked examples
Example 1 — Adding a large value
For , , , , , find the mean, median, and range. Then add and find them again.
Before: ; median ; range .
After: ; median ; range .
Answer: The mean rises from to , the median from to , and the range from to .
Example 2 — Adding a value equal to the mean
For , , , , add the value and describe the effect.
Before: mean , median , range . After: mean , median , range .
Answer: None of the three measures changes, because the added value sits exactly at the balance point and does not extend either end.
Example 3 — Removing a value
For , , , , , remove and describe the effect.
Before: mean , median , range . After: mean , median , range .
Answer: Mean falls from to , median falls from to , and range falls from to .
Example 4 — Changing a value
For , , , , change to .
Before: mean , median , range . After: mean , median , range .
Answer: The mean rises by and the range rises by ; the median is unchanged because the middle two values are the same.
Example 5 — A change that moves the mean but not the median
For , , , , , change the to .
Before: mean , median .
After: the data are , , , , , so and the middle value is still .
Answer: The mean rises from to ; the median stays , because the changed value is still below the middle value in the ordered list.
Guided practice
- For , , , find the mean and median. Then remove and find them again.
- For , , , , , find the mean, median, and mode. Then add and find them again.
- For , , , , find the mean and median. Then change to and find them again.
- If you add a value less than the mean, does the mean go up or down? Explain.
- Explain how the mean can change while the median stays the same.
Independent practice
- For , , , , , find the mean, median, and range. Then add and find all three again.
- For , , , , find the mean, median, and range. Then remove and find all three again.
- For , , , , , find the mean, median, mode, and range. Then change to and find all four again.
- The data set , , has a mean of . What value could you add so the mean stays ? Explain.
- The data set , , has a mean of . What single value should you add so the new mean is ?
- Application. Kara's first five bowling scores are , , , , and . Find the mean, median, and range. She then bowls a . Find all three again and describe, in a sentence, how her sixth game changed the picture of her bowling.
- Reasoning. Which measure — mean, median, or mode — is usually affected most by adding one very large value? Explain why, using the balance point idea.
Exit ticket 17.3
- The data set , , has a mean of . Find the new mean after adding .
- Find the median of , , , . Then find the median after removing .
- For , , , , change the to and find the new mean.
- Explain what happens to the mean when you add a value below the mean, and why.
Lesson 17.4 — Outliers and Their Effect
Spotting an outlier by looking
An outlier is a data value that is far away from the rest of the values in the set. You identify outliers in this course by observing patterns in the data, not by applying a formula. On a dot plot, an outlier shows up as a lone dot separated from the main cluster by a noticeable gap.
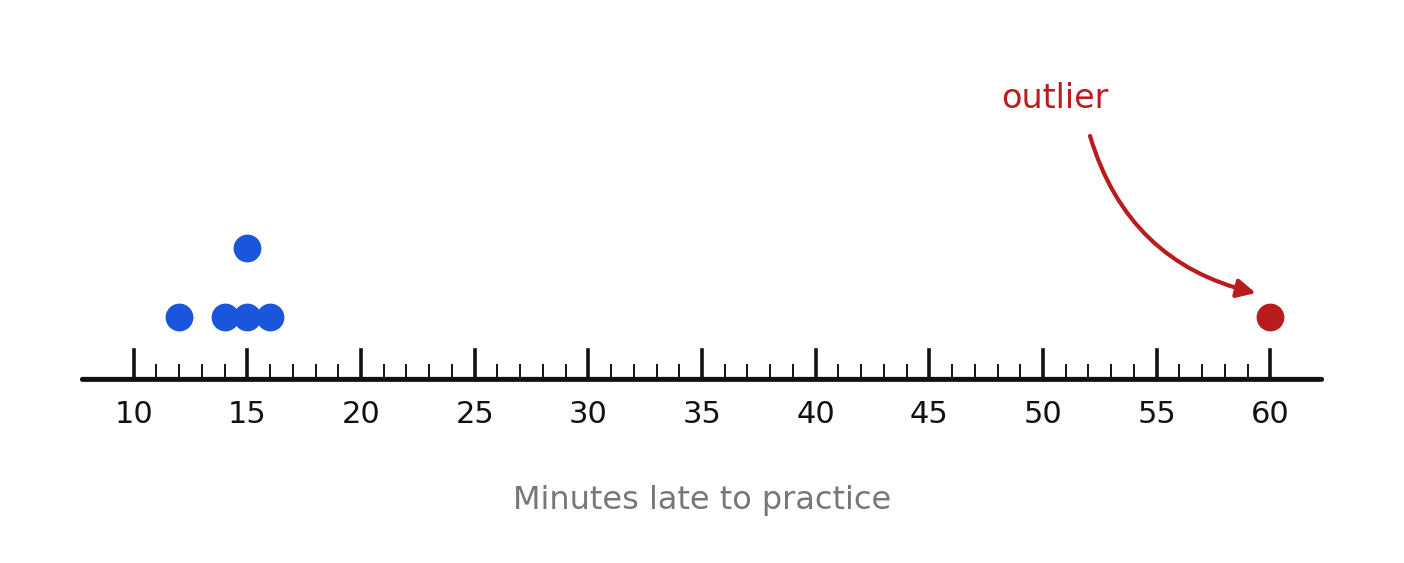
Two habits make this reliable:
- Order the data or plot it. Outliers are obvious in a picture and easy to miss in a list.
- Look for the gap, not just the biggest number. In , , , , , , the value is the greatest, but nothing is separated from anything, so there is no outlier.
Outliers may be low as well as high. In , , , , , , the outlier is .
What an outlier does to each measure
Take the data , , , , , . The sits far from the cluster.
With the outlier:
Without the outlier: the data are , , , , .
| Measure | With outlier | Without outlier | Change |
|---|---|---|---|
| Mean | drops by | ||
| Median | none | ||
| Mode | none | ||
| Range | drops by |
The pattern in that table is the heart of this lesson:
An outlier strongly affects the mean and the range. It usually has little or no effect on the median and the mode.
The balance picture explains the mean's sensitivity. A value far from the rest is a weight far from the fulcrum, so it tips the board hard. The median only asks which value is in the middle position, and a single far-off value shifts that position by at most one step. The mode counts repeats, and one lone value rarely repeats at all.
The range is affected because it is computed from the two extreme values, and an outlier is an extreme value.
A low outlier
Data: , , , , , .
With the outlier:
Without the :
A low outlier drags the mean down just as a high one pushes it up, while the median moves only slightly.
Deciding what to do about an outlier
Finding an outlier is not the same as deleting it. Ask where it came from.
- If it is a recording error — a stopwatch left running, a typo of for — correct it or remove it, and say that you did.
- If it is a real value — one student genuinely was 60 minutes late — keep it. Then report the median alongside the mean, so readers see both the typical value and the effect of the unusual one.
Never remove a value simply because it is inconvenient. Always state what you did and why.
Worked examples
Example 1 — Effect of a high outlier
Identify the outlier in , , , , , , and find the mean, median, mode, and range with and without it.
The sits far above a cluster in the low teens.
With: ; median ; mode ; range .
Without: ; median ; mode ; range .
Answer: The outlier is . Removing it changes the mean from to and the range from to ; the median and mode stay at .
Example 2 — A low outlier
Identify the outlier in , , , , , and describe its effect on the mean, median, and range.
With: ; median ; range . Without: ; median ; range .
Answer: The outlier is . It lowers the mean by and raises the range by , while moving the median only from to .
Example 3 — A small set
Identify the outlier in , , , , and give the effect on the mean, median, and range.
With: ; median ; range . Without: the data are , , , , so ; median ; range .
Answer: The outlier is . It more than doubles the mean, from to , and raises the range from to , while the median moves only from to .
Example 4 — Reading a dot plot
Use the "Minutes Late to Practice" dot plot above, whose values are , , , , , . Name the outlier and explain how the plot shows it.
The dots cluster between and , then nothing appears until .
Answer: The outlier is , shown by a lone dot separated from the cluster by a wide gap.
Example 5 — No outlier
Does , , , , , contain an outlier? Give the mean, median, and range.
The values step up steadily, with no gap.
Answer: No outlier. The mean and median are both , which is what you expect when no value sits far from the rest.
Guided practice
- Identify the outlier in , , , , , , then find the mean, median, and range with the outlier and again without it.
- In question 1, which measure changed the most when the outlier was removed?
- Identify the outlier in , , , , , , , , then find the mean, median, and range without it.
- Does an outlier always raise the mean? Explain.
- Explain how a gap on a dot plot signals an outlier.
Independent practice
- For , , , , : name the outlier, then find the mean, median, mode, and range with and without it.
- For , , , , : name the outlier, then find the mean, median, and range with and without it.
- Which measures of center are least affected by an outlier? Explain why.
- A dot plot shows dots at , , , , , and one lone dot at . Name the outlier and predict, without computing, whether the mean will be greater or less than the median.
- Explain why the mode is usually unaffected when a single outlier is added to a data set.
- Application. Five students report their weekly allowance in dollars: , , , , . Find the mean and median with and without the outlier, then state which measure you would use to describe a typical allowance and why.
- Reasoning. A science class records reaction times and finds one value far above the rest. Describe how the class should decide whether to keep or remove that value, and explain what they must report either way.
Exit ticket 17.4
- Name the outlier in , , , , .
- Find the mean of that data set with the outlier and again without it.
- Find the median with and without the outlier, and say how much it changed.
- Explain how you identify an outlier by observing patterns in the data.
Chapter 17 Review
Vocabulary. mean · line plot (dot plot) · balance point · measure of center · median · mode · range · outlier
Part A — Mean as a balance point (6.PS.2a)
- Find the mean of , , , , and show that the total distance on each side of the mean is equal.
- A dot plot shows dots at , , , and . Find the balance point.
- The data set , , has a mean of . Find the missing value.
- Explain why the mean must always lie between the least and greatest values of a data set.
Part B — Effect of adding, removing, or changing a value (6.PS.2b)
- For , , , , : find the mean, median, and range. Then add and find all three again.
- For , , , , : find the mean and median. Then remove and find them again.
- For , , , : find the mean and median. Then change to and find them again.
- The data set , , , has a mean of . Name a value you could add that leaves the mean unchanged, and explain why it works.
- Explain why the median can stay the same when a value at one end of the data set is changed.
Part C — Outliers (6.PS.2c)
- Identify the outlier in , , , , , , and give the mean, median, mode, and range with and without it.
- Identify the outlier in , , , , , , and give the mean, median, and range with and without it.
- Does the data set , , , , , contain an outlier? Explain, and give its mean and median.
- Which two measures are most affected by an outlier, and which two are least affected? Explain why.
Part D — Mixed application and reasoning
- Seven students record the minutes they spent on homework: , , , , , , . Find the mean, median, mode, and range. Identify any outlier and describe its effect on the mean.
- A teacher reports that the mean test score is while the median is . Describe what the data probably look like and explain your reasoning.
- A student says, "Removing the outlier always makes the mean smaller." Give a counterexample and explain the error.
- A stopwatch recorded a runner's time as seconds when every other runner finished near seconds. Explain how to decide what to do with that value, what to report, and why the median is useful here.
Standards coverage check — Chapter 17
| Knowledge and Skill | Where it is taught | Where it is practiced |
|---|---|---|
| 6.PS.2a — represent the mean of a data set graphically as the balance point on a line plot (dot plot) | 17.1 | 17.1 all sets; 17.2 item 10; Review Part A |
| 6.PS.2b — determine the effect on measures of center when a single value is added, removed, or changed | 17.3 | 17.3 all sets; 17.2 all sets provide the measures; Review Part B |
| 6.PS.2c — observe patterns in data to identify outliers and determine their effect on mean, median, mode, or range | 17.4 | 17.4 all sets; Review Part C, items 14–17 |
Answer keys for every set in this chapter are in Appendix A.